Volatility, Market Timing, and Long-Term Investing
For many savers, the objective of a retirement account is to accumulate assets while you are working and use those assets to pay for your expenses during retirement. While you are in the accumulation phase, assets are usually invested and hopefully earn a sufficient rate of return to meet your retirement goal. For the majority,
Volatility, Market Timing, and Long-Term Investing
For many savers, the objective of a retirement account is to accumulate assets while you are working and use those assets to pay for your expenses during retirement. While you are in the accumulation phase, assets are usually invested and hopefully earn a sufficient rate of return to meet your retirement goal. For the majority, these accounts are long-term investments and there are certain investing ideas that should be taken into consideration when managing portfolios. This article will discuss volatility, market timing and their role in long-term retirement accounts.
“Market timing is the act of moving in and out of the market or switching between asset classes based on using predictive methods such as technical indicators or economic data” (Investopedia). In other words, trying to sell investments when they are near their highest and buy investments when they are near their lowest. It is difficult, some argue impossible, to time the market successfully enough to generate higher returns. Especially over longer periods. That being said, by reallocating portfolios and not experiencing the full loss during market downturns, investors could see higher returns. When managing portfolios over longer periods, this should be done without the emotion of day to day volatility but by analyzing greater economic trends.
So far, the stock market in 2018 has been volatile; particularly when compared to 2017. Below are charts of the S&P 500 from 1/1/2018 – 10/21/2018 and the same period for 2017.
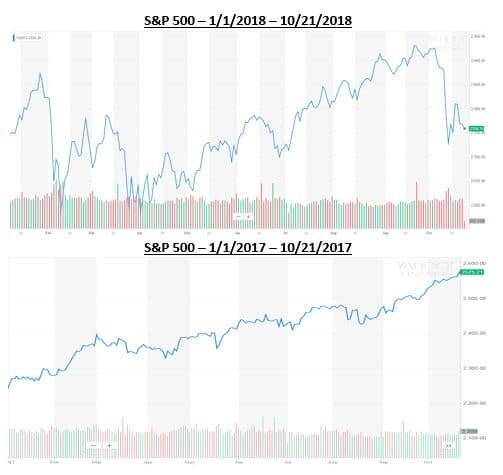
Source: Yahoo Finance. Information has been obtained from sources believed to be reliable and are subject to change without notification.
Based on the two charts above, one could conclude the majority of investors would prefer 2017 100% of the time. In reality, the market averages a correction of over 10% each year and there are years the market goes up and there are years the market goes down. Currently, the volatility in the market has a lot of investors on edge, but when comparing 2018 to the market historically, one could argue this year is more typical than a year like 2017 where the market had very little to no volatility.
Another note from the charts above are the red and green bars on the bottom of each year. The red represent down days in the market and the green represent up days. You can see that even though there is more volatility in 2018 compared to 2017 when the market just kept climbing, both years have a mixture of down days and up days.
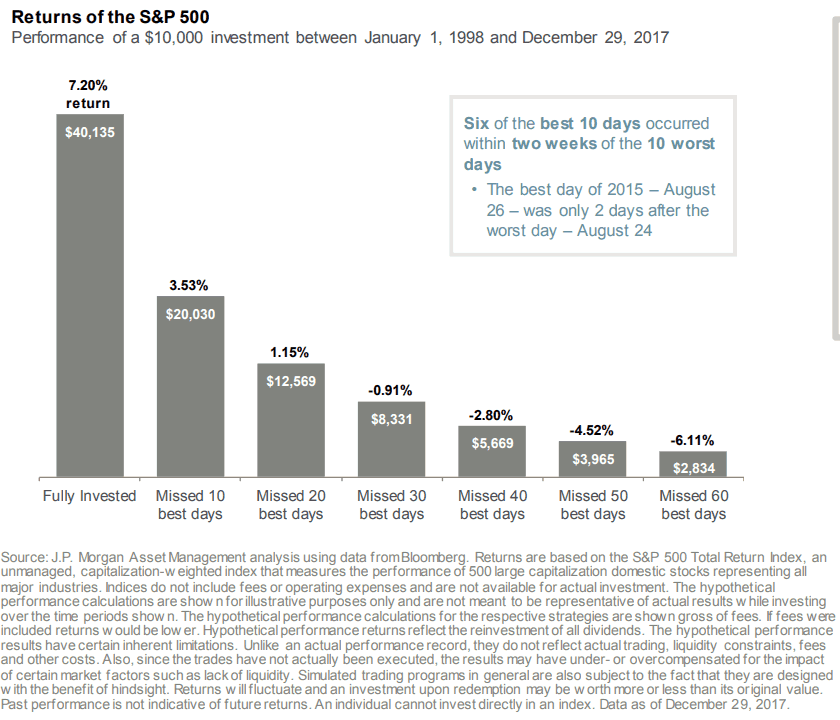
A lot of investors become emotional when the market is volatile but even in the midst of volatility and downturns, there are days the market is up. The chart below shows what happens to long-term portfolio performance if investors miss the best days in the market during that period.
Source: JP Morgan. Information has been obtained from sources believed to be reliable and are subject to change without notification.
Two main takeaways from the illustration above are; 1) missing the best days over a period in the market could have a significant impact on a portfolios performance, and 2) some of the best days in the market over the period analyzed came shortly after the worst days. This means that if people reacted on the worst days and took their money from the market then they likely missed some of the best days.
Market timing is difficult over long periods of time and making drastic moves in asset allocation because of emotional reactions to volatility isn’t always the best strategy for long-term investing. Investors should align their portfolios taking both risk tolerance and time horizon into consideration and make sure the portfolio is updated as each of these change multiple times over longer periods.
When risk tolerance or time horizon do not change, most investors should focus on macro-economic trends rather than daily/weekly/monthly volatility of the market. Not experiencing the full weight of stock market declines could generate higher returns and if data shows the economy may be slowing, it could be a good time to take some “chips off the table”. That being said, looking at past down markets, some of the best days occur shortly after the worst days and staying invested enough to keep in line with your risk tolerance and time horizon could be the best strategy.
It is difficult to take the emotion out of investing when the money is meant to fund your future needs so speaking with your financial consultant to review your situation may be beneficial.
About Rob……...
Hi, I’m Rob Mangold. I’m the Chief Operating Officer at Greenbush Financial Group and a contributor to the Money Smart Board blog. We created the blog to provide strategies that will help our readers personally, professionally, and financially. Our blog is meant to be a resource. If there are questions that you need answered, please feel free to join in on the discussion or contact me directly.


Target Date Funds: A Public Service Announcement
Before getting into the main objective of this article, let me briefly explain a Target Date Fund. Investopedia defines a target date fund as “a fund offered by an investment company that seeks to grow assets over a specified period of time for a targeted goal”. The specified period of time is typically the period until the date you “target” for retirement

Target Date Funds: A Public Service Announcement
Before getting into the main objective of this article, let me briefly explain a Target Date Fund. Investopedia defines a target date fund as “a fund offered by an investment company that seeks to grow assets over a specified period of time for a targeted goal”. The specified period of time is typically the period until the date you “target” for retirement or to start withdrawing assets. For this article, I will refer to the target date as the “retirement date” because that is how Target Date Funds are typically used.
Target Date Funds are continuing to grow in popularity as Defined Contribution Plans (i.e. 401(k)’s) become the primary savings vehicle for retirement. Per the Investment Company Institute, as of March 31, 2018, there was $1.1 trillion invested in Target Date Mutual Funds. Defined Contribution Plans made up 67 percent of that total.
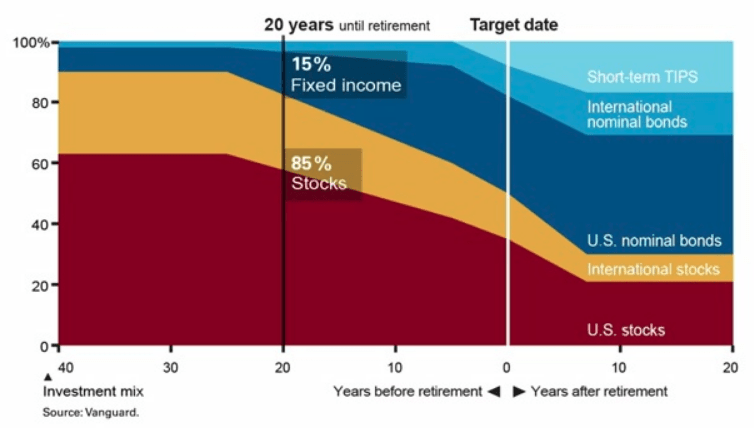
Target Date Funds are often coined as the “set it and forget it” of investments for participants in retirement plans. Target Date Funds that are farther from the retirement date will be invested more aggressively than target date funds closer to the retirement date. Below is a chart showing the “Glide Path” of the Vanguard Target Date Funds. The horizontal access shows how far someone is from retirement and the vertical access shows the percentage of stocks in the investment. In general, more stock means more aggressive. The “40” in the bottom left indicates someone that is 40 years from their retirement date. A common investment strategy in retirement accounts is to be more aggressive when you’re younger and become more conservative as you approach your retirement age. Following this strategy, someone with 40 years until retirement is more aggressive which is why at this point the Glide Path shows an allocation of approximately 90% stocks and 10% fixed income. When the fund is at “0”, this is the retirement date and the fund is more conservative with an allocation of approximately 50% stocks and 50% fixed income. Using a Target Date Fund, a person can become more conservative over time without manually making any changes.
Note: Not every fund family (i.e. Vanguard, American Funds, T. Rowe Price, etc.) has the same strategy on how they manage the investments inside the Target Date Funds, but each of them follows a Glide Path like the one shown below.
The Public Service Announcement
The public service announcement is to remind investors they should take both time horizon and risk tolerance into consideration when creating a portfolio for themselves. The Target Date Fund solution focuses on time horizon but how does it factor in risk tolerance?Target Date Funds combine time horizon and risk tolerance as if they are the same for each investor with the same amount of time before retirement. In other words, each person 30 years from retirement that is using the Target Date strategy as it was intended will have the same stock to bond allocation.This is one of the ways the Target Date Fund solution can fall short as it is likely not possible to truly know somebody’s risk tolerance without knowing them. In my experience, not every investor 30 years from retirement is comfortable with their biggest retirement asset being allocated to 90% stock. For various reasons, some people are more conservative, and the Target Date Fund solution may not be appropriate for their risk tolerance.The “set it and forget it” phrase is often used because Target Date Funds automatically become more conservative for investors as they approach their Target Date. This is a strategy that does work and is appropriate for a lot of investors which is why the strategy is continuing to increase in popularity. The takeaway from this article is to think about your risk tolerance and to be educated on the way Target Date Funds work as it is important to make sure both are in line with each other.For a more information on Target Date Funds please visit https://www.greenbushfinancial.com/target-date-funds-and-their-role-in-the-401k-space/
About Rob……...
Hi, I’m Rob Mangold. I’m the Chief Operating Officer at Greenbush Financial Group and a contributor to the Money Smart Board blog. We created the blog to provide strategies that will help our readers personally, professionally, and financially. Our blog is meant to be a resource. If there are questions that you need answered, please feel free to join in on the discussion or contact me directly.


Patience Should Reward Investors In 2018
Bottom line, the first half of 2018 was a tough pill to swallow for investors. They had to fight a constant rollercoaster. Volatility was high, returns were low, and the news was dominated with fears of trade wars. This environment has left investors questioning if we are on the eve of the next recession. Well I have good news. While trade wars have driven

Bottom line, the first half of 2018 was a tough pill to swallow for investors. They had to fight a constant rollercoaster. Volatility was high, returns were low, and the news was dominated with fears of trade wars. This environment has left investors questioning if we are on the eve of the next recession. Well I have good news. While trade wars have driven fear into the hearts of investors, during that same time period corporate earnings have been soaring and the U.S. economy has continued its growth path. For these reasons, disciplined investors may have good things waiting for them in the second half of 2018.
Coming Off A Big Year
As of the end of the second quarter, the S&P 500 Index was up 2.6% year to date. So why does 2018 seem like such a disappointment? You have to remember that 2017 was a huge year with the added benefit of very little volatility. It was a straight march up the entire year.
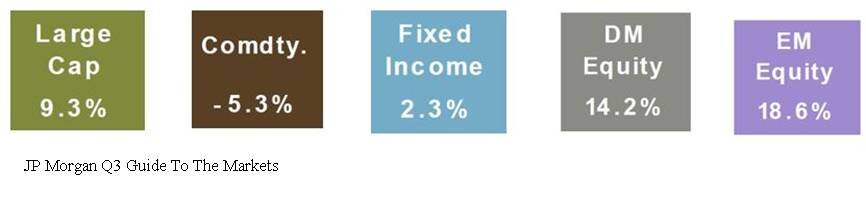
First, let’s compare the performance of the various asset classes in the first half of 2017 versus to first half of 2018. Below are the returns for the various assets classes in the first half of 2017:
Here are those same asset classes in the first half of 2018.
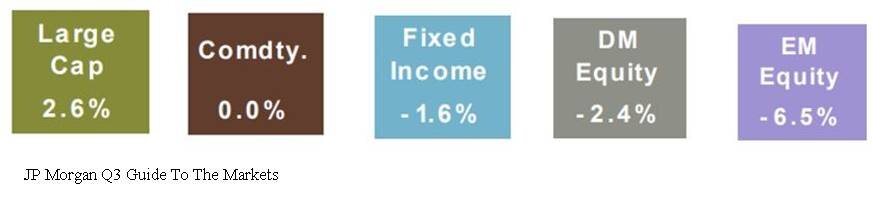
Obviously a huge difference. At this time last year, the S&P 500 Index was already up 9.3% for the year compared to 2.6% in 2018. International and emerging market equities were up over 14% in the first half of 2017. In 2018, those same international stocks were down over 2%. One might guess that bonds would preform better in a year with muted stock returns. Well, one would be wrong because the Barclay’s US Aggregate Bond Index was down 1.6% in the first 6 months of 2018.
Volatility Is Back
Not only has the first half of 2018 been a return drought but the level of volatility in the stock market has also spiked. In the first 6 months of 2017, the S&P 500 Index only had 2 trading days where the stock market moved plus or minus by more than 1% in a day. Guess how many trading days there were in the first half of 2018 where the S&P 500 Index moved up or down by more than 1% in a day.
The answer: 25 Days
That’s a 1,250% increase over 2017. No wonder everyone’s nerves are rattled. So the up 2% YTD in the stock market feels more like a down 10% because a lot has happened in a short period of time. Plus, the only big positive month for the stock market was in January which feels like forever ago.
Recency Bias
Investors are largely suffering for what we call in the investment industry as “recency bias”. In other words, what happened recently has now become the rule in the minds of investors. Investors are largely using 2017 as their measuring stick for 2018 performance and volatility. While it would seem that the dramatic increase in the level of volatility this year would classify 2018 as an abnormally volatile year, it’s actually 2017 that was the anomaly. Below is a chart that shows the annual return of the S&P 500 Index since 1980. The dots below each annual return are the market corrections that took place as some point during each calendar year.
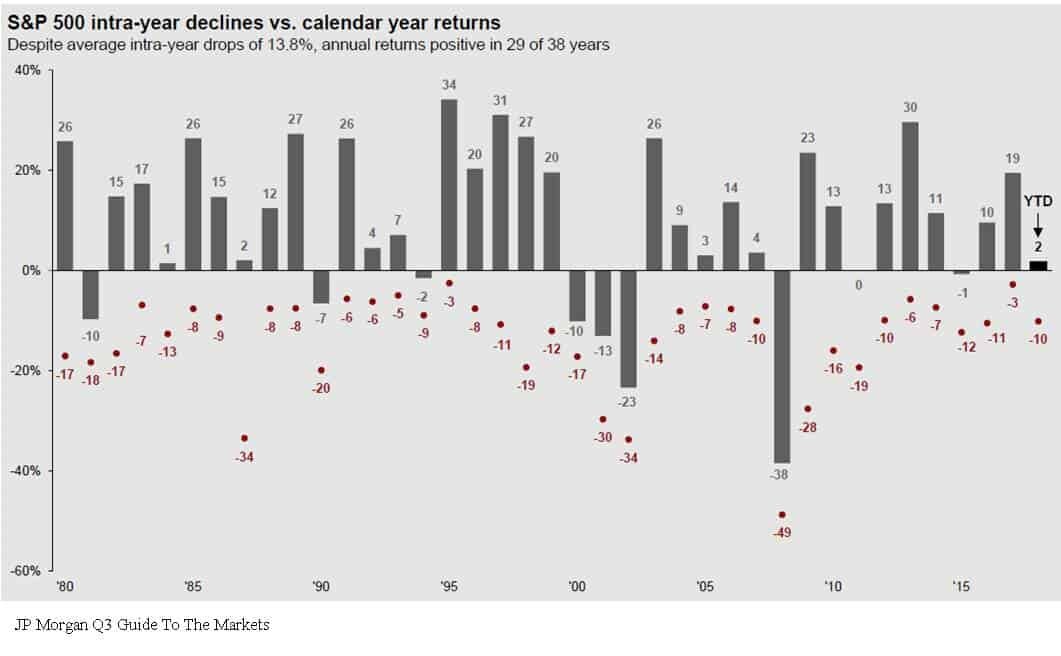
Based on historical data, it’s “normal” for the market to experience on average a 10% correction at some point during the year. Now look at 2017, the stock market was up 19% for the year but the largest correction during the year was 3%. That’s abnormal. By comparison, even though we are only half way through 2018, we have already experienced a 10% correction and as of June 30th, the S&P 500 Index is up 2% for the year.
Earnings Are King
Behind the dark clouds of the media headlines and the increased level of volatility this year is the dramatic increase in corporate earnings. Corporate earnings have not only increased but they have leaped forward. Take a look at the chart below:
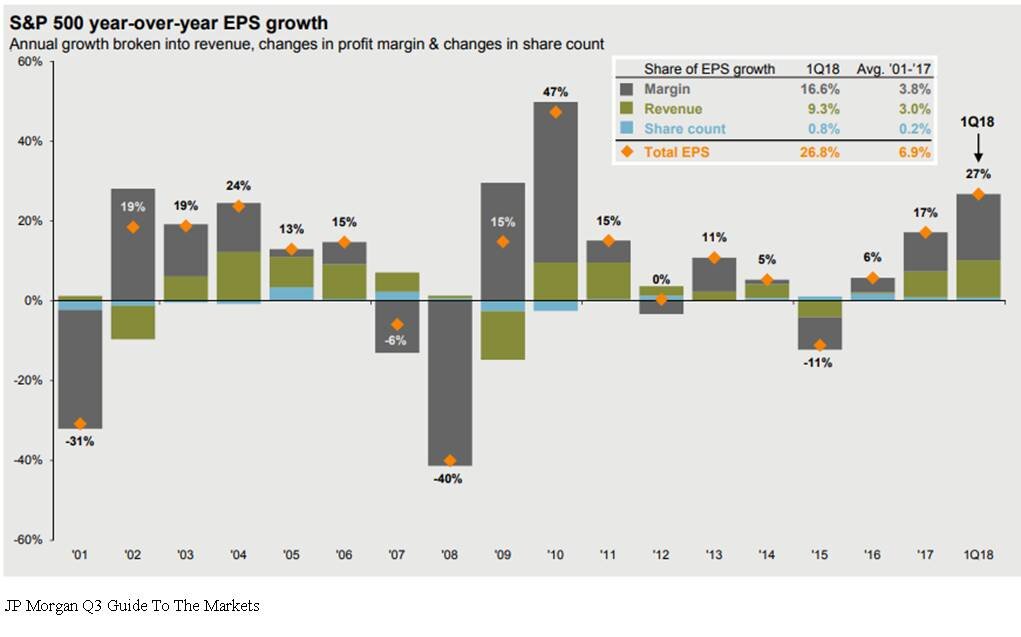
The market traditionally follows earnings. The earnings per share for the S&P 500 Index in 2017 was 17% which is a strong number historically. In the first quarterly of 2018, the year-over-year earnings per share growth was up 27%. That is a surge in corporate earnings. But you would have no idea looking at the meager 2% YTD return from the stock market this year. Pair that with the fact that the P/E of the S&P 500 is around 16 which is in line with its 20 year historic average. See the chart below:
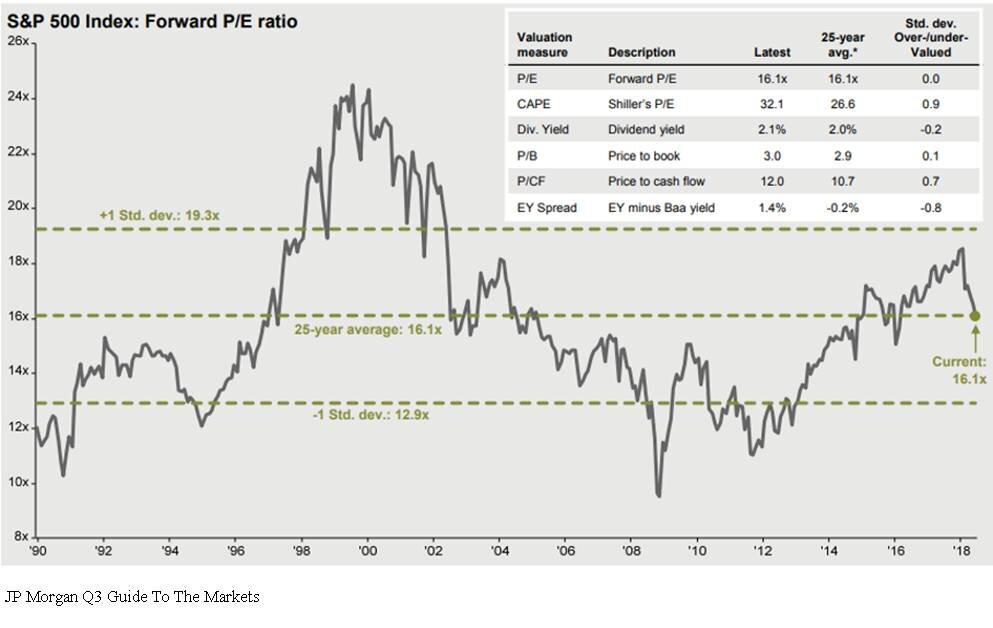
Even though it has been a long expansion, the market is not “over priced” by historic terms. If the stock market is fairly valued and corporate earnings are accelerating, one could make the case that the stock market has some catching up to do in the second half of the year.
The Chances Of A Recession Are Low
With the yield curve still positively sloped and the Composite Index of Leading Indicator, not only positive, but accelerating, a recession within the next 6 to 12 months seems unlikely. It’s like wandering through a jungle. When you are on the ground, the jungle is intimidating, there are plenty of things to be afraid of, and it’s tough to know which direction you should be walking. As investment advisors it’s our job to climb the tallest tree to get above the jungle to determine which way we should be walking.
In summary, 2018 has been an emotional roller coaster for investors. But making sound investment decision is about putting your emotions and gut feelings aside and looking at the hard economic data when making investment decisions. That data is telling us that we may very well be witnessing the soon to be longest economic expansion since 1900. The U.S. economy is strong, tax reform is boosting corporate earnings, interest rates are rising but are still at benign levels, and consumer sentiment is booming. In the later stages of an economic cycle, higher levels of volatility will be here to stay which will test the patience of investors. But overall the second half of the year could prove to be beneficial for investors that choose to climb the trees.

About Michael.........
Hi, I’m Michael Ruger. I’m the managing partner of Greenbush Financial Group and the creator of the nationally recognized Money Smart Board blog . I created the blog because there are a lot of events in life that require important financial decisions. The goal is to help our readers avoid big financial missteps, discover financial solutions that they were not aware of, and to optimize their financial future.


Does "Sell In May And Go Away" Really Work?
There is a well-known trading strategy that goes by the name of "Sell In May And Go Away". The strategy involves liquidating all of your stock holdings in May and then re-establishing your stock positions in November. The basic premise of this strategy is when you reference performance data from the stock market for the past 100 years, two of

sell in may and go away
There is a well-known trading strategy that goes by the name of "Sell In May And Go Away". The strategy involves liquidating all of your stock holdings in May and then re-establishing your stock positions in November. The basic premise of this strategy is when you reference performance data from the stock market for the past 100 years, two of the three worse months typically occur between May and October. But does it really work?
Losing Strategy
While there are years that we can point to that the "Sell In May" strategy would have worked, it would have been a losing strategy for the past 4 out of 5 years.

The only year that strategy would have worked within the last five years was in 2015 and you avoid a minuscule 1% loss. On the flip side, you missed a huge 11.6% gain in 2017. If you implemented this strategy every year for the past 5 years, it would have cost you 22.4% in investment returns. Not good.
Looking Back Further
Instead of looking back just 5 years, let’s look back 10 years from 2008 to 2017. The “Sell In May” strategy would have only worked 4 out of 10 times. So it would have been the losing strategy 60% of the time. Again, not good.
So why do you hear so much about it? Looking at the market data, even though it has not been a reliable source as to whether or not the stock market will be up or down during the May to October months, the return data of the Dow Jones Industrial Average suggests historically that the largest returns are found during the November through April months.
A perfect example is 2010. In 2010, the Dow Jones Industrial Average produced a return of 1% between May – October. However, the Dow Jones produced a 15.2% rate of return in 2010 between November and April. Implementing the “Sell In May” strategy would have cost you 1% in return since you were not invested during the summer months but you still captured the lion share of the return from the stock market for the year.
Also, when the economy is in a recession, May through October typically contains the months that produce the largest losses for the Dow. During the 2008 recession, the Dow was down 27.3% between May and October but it was only down 12.4% between November and April. Likewise, during the 2001 recession, the Dow was down 15.5% between May and October but it was actually positive 9.6% between November and April.
Measure of Magnitude Not Direction
The further you dig into the data, the more it seems that the "Sell In May" strategy is a more accurate measure of "magnitude" instead of direction. Let's compare the May to October vs. the November to April return data of the Dow Jones Industrial Average 2008 – 2015 from Stock Almanac.

stock market returns
Looking at this time period, the losses were either less severe or the gains were greater between the November and April time frame 6 out of 8 years or 75% of the time. Compared with only 3 out of the 8 years where the direction of the returns were different when comparing those two time frames or 37.5% of the time.
Recession vs. Expansion
I think there are a number of takeaways from looking at this data. One might conclude that when U.S. economy is in a period of expansion, the "Sell In May" strategy has less than a coin flip chance of creating a more favorable investment return. However, when the economy is in a recession, the historical data may also suggest that more weight be given to the strategy since May through October in the past two recessions has contained the largest drops in the stock market.With all of that said, timing the market is very difficult and many investment professionals even label it as foolish. In general, long term investors are often better served by selecting an asset allocation that is appropriate for their risk tolerance and time horizon and staying the course.
About Michael.........
Hi, I’m Michael Ruger. I’m the managing partner of Greenbush Financial Group and the creator of the nationally recognized Money Smart Board blog . I created the blog because there are a lot of events in life that require important financial decisions. The goal is to help our readers avoid big financial missteps, discover financial solutions that they were not aware of, and to optimize their financial future.


What Happened The Last Time The Dow Dropped By More Than 4% In A Day?
Yesterday was an “ouch”. The Dow Jones Industrial average dropped by more than 1000 points resulting in a 4.60% drop in the value of the index. While yesterday marked the largest “point” decline in the history of the Dow Jones Index, it was not anywhere near the largest percentage decline which is the metric that we care about.

Yesterday was an “ouch”. The Dow Jones Industrial average dropped by more than 1000 points resulting in a 4.60% drop in the value of the index. While yesterday marked the largest “point” decline in the history of the Dow Jones Index, it was not anywhere near the largest percentage decline which is the metric that we care about.
Below is a chart that shows the largest daily “point” losses in the history of the Dow Jones Industrial Index:
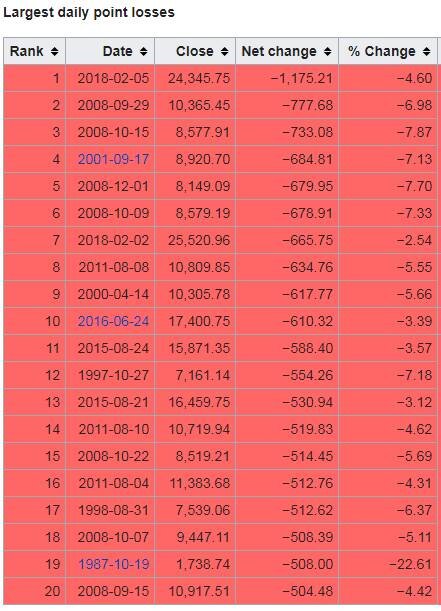
You will find yesterday at the top of the chart. Now look at the column all the way to the right labelled “% change”. You will notice that while yesterday topped the chart from a point decline, it does not come anywhere near the largest percentage decline that we have seen. In fact, it does not even make it in the top 20 worse days for the Dow. See the chart below that shows the largest daily percentage declines in the Dow’s history:

What Happened Last Time?
Whenever there is a big drop in the stock market, I immediately start looking back in history to find market events that are similar to the current one. So when was the last time the market dropped by more than 4% in a single day?
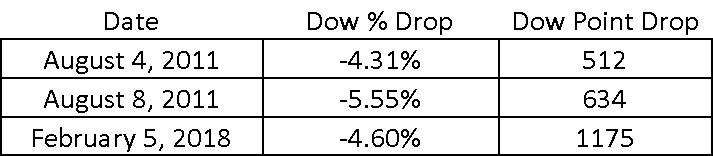
The answer: August 8, 2011
If you remember, 2011 was the start of the European Sovereign Debt Crisis. That was when Greece, Portugal, Spain, and Ireland announced that they were unable to repay their government debt and needed a bailout package from the European Union to survive. There were two single day declines in the month of August that rivaled what we saw yesterday.
How Long Did It Take The Market To Come Back?
If we are looking to history as a guide, how long did it take for the market to recoup the losses after these large single day declines? On July 31, 2011 the Dow Jones Industrial closed at 11,444, the Europe debt crisis hit, and the market experienced those two 4%+ decline days on August 4th and August 8th. By September 11, 2011, the Dow Jones closed at 11,509, recouping all of its losses from the beginning of August. Thus making the answer to the question: 38 days. The market took 38 days to recoup all of the losses from not one but two 4%+ decline days in 2011.
We Don’t Have A Crisis
The main difference between 2011 and now is we don’t have a global economic crisis. In my opinion, the market correction in 2011 was warranted. There was a real problem in Europe. We were not sure how and if those struggling Eurozone countries could be saved so the market dropped.
The only trigger that I hear analysts pointing to in an effort to explain the selloff yesterday is the 2.9% wage growth number that we got on Friday. This in turn has sparked inflation fears and in reaction, the Fed may decide to hike rates four times this year instead of three. Hardly a “crisis”. Outside of that nothing else meaningful has happened to trigger the volatility that we are seeing in the stock market. OK……so what should you do in reaction to this? Sometimes the right answer is “nothing”. It’s difficult to hear that because emotionally you want to pull money out of the market and run to cash or bonds but absent a sound economic reason for making that move, at this point, the best investment decision may be to just stay the course.
We Have Forgotten What Volatility Feels Like
When you are in a market environment like 2017, you very quickly forget what normal market volatility feels like. In 2017, the stock market just gradually climbed throughout the year without any hiccups. That’s not normal. Below is a chart that shows the magnitude of market corrections each year going back to 1990. As you will see, on average, when the economy is not in a recession, the market averages an 11.56% correction at some point during the year. In 2017, we only experienced a 3% correction.

intra year drops in the S&P 500 Index
Now the next chart shows you the big picture. Not only does it illustrate the amount of the largest market correction during the year but it also shows the return of the S&P 500 for the year.

Look at 2016. In 2016, at some point in the year the S&P 500 Index dropped by 11%. If you just held through it, the S&P 500 returned 10% for the year.
In 2011, the S&P 500 dropped by 19% during the year!! If you didn’t sell and just held through the volatility, you would have had a breakeven year.
Easier Said Than Done
Every big market correction feels like a new world ending crisis. It’s not. We have been fortunate enough to have a nice easy ride for the past 12 months but it seems like we are returning to more historical levels of volatility. Days like February 5, 2018 will test your patience and make you feel compelled to react. It’s easy to look back and confess that “yes, I should have just held through it” but it’s easier said than done.
It’s important to understand the catalysts that are driving the volatility in the markets. Sometimes the markets are dropping for a good reason and other times it’s just plain old fashion volatility. Based on what we have seen over the past few days and absent the emergence of a new economic, political, or global crisis, we expect it to be the later of the two.
About Michael……...
Hi, I’m Michael Ruger. I’m the managing partner of Greenbush Financial Group and the creator of the nationally recognized Money Smart Board blog . I created the blog because there are a lot of events in life that require important financial decisions. The goal is to help our readers avoid big financial missteps, discover financial solutions that they were not aware of, and to optimize their financial future.


The Dow Dropped 362 Points Yesterday. Now What?
When you hear that the Dow Jones Industrial Average dropped by over 300 points it gets your attention. It triggers that automatic emotional response which leads you to ask, "Is the market rally ending?" I'm going to start this article by saying "I'm not a cheerleader for the stock market". As a cheerleader, it's your job to cheer whether your team is
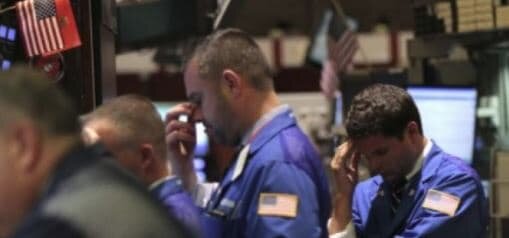
When you hear that the Dow Jones Industrial Average dropped by over 300 points it gets your attention. It triggers that automatic emotional response which leads you to ask, "Is the market rally ending?" I'm going to start this article by saying "I'm not a cheerleader for the stock market". As a cheerleader, it's your job to cheer whether your team is winning or losing. Sometimes the general public views investment advisors that way. "Of course my advisor has a rosy outlook. He wants me to stay invested".
My view is when the cycle is ending it's ending. When the data tells us that we are headed toward the next recession, you just have to accept a lower expected rate of return and make the necessary allocation changes to preserve principal during the market downturn. The answer is not always "just hold through it" which is unfortunately the answer that some investors receive from their advisor regardless of what's happening in the markets and the economy.
What Has Changed?
Whenever you have a big down day in the market the first question you should ask yourself is "What changed?" I know the value of the stock market changed but the question I'm really asking is what fundamental change happened in the U.S. economy to trigger the selloff?
Did GDP growth rate pull back unexpectedly?
Did the monthly jobs report come up short? Did inflation increase by a large number that wasn't expected?
Are corporate earnings deteriorating?
Has the leading indicators index turned negative?
These are the real questions that you should be asking. Remember, the economy leads the stock market. The stock market does not lead the economy. Watching the fluctuations in the stock market and using that as a tool to make investment decisions is a recipe for disaster. You are much more likely to find success in your investments if you use a trading app uk that is able to help you track prices and automate your trading.
A growing economy typically means higher corporate earnings
Higher corporate earnings often results in higher stock prices
With that said, sometimes the market is down because it's reacting to poor economic data. In those cases, the market downturn may be warranted. However, that is not what I think happened yesterday. We did not get a bad jobs number or shortfall in GDP growth. In short, as of yesterday, nothing has changed from an economic standpoint. Days like yesterday are just a reminder of what volatility in the markets feels like.
Higher Volatility Ahead
If you asked me if I expect more or less days like yesterday in 2018, my guess would be more. We are all suffering from "recency bias". 2017 was this nice smooth ride higher with very few interruptions. When you get used to sailing in smooth waters, a small wave can seem like a tsunami. Below is a chart of the CBEO Vix Index from January 2002 – January 2018 which is used to gauge the level of volatility in the U.S. stock market:
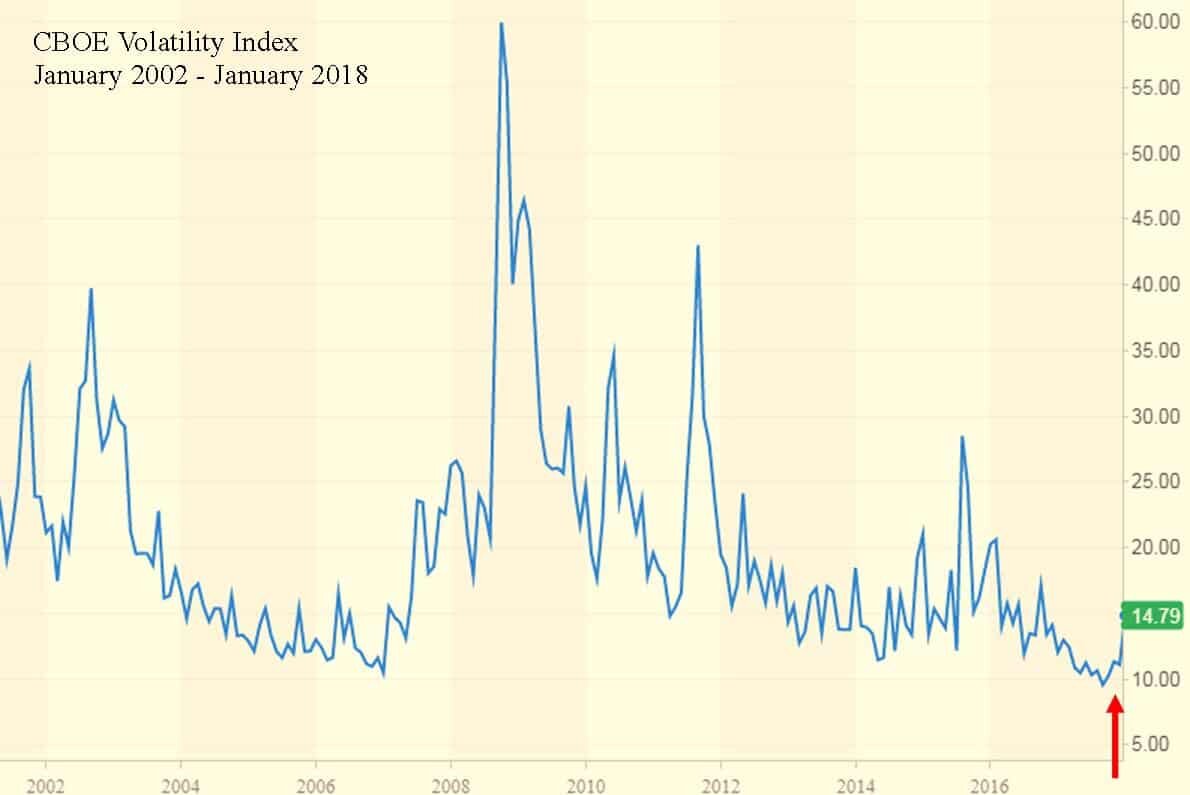
As you can see, we are coming off of historically low levels of volatility and we have to remember that volatility is normal. Every down tick in the stock market is not necessarily a signal that a recession is coming.
The Math Is Different
What if I told you that the market was only down 177 points yesterday? It probably does not trigger the same fear reaction as being down over 350 points. The reason why I ask this question is you have to remember that the price level of the Dow has doubled over the last 6 years. So a 300 point drop in the Dow Jones Industrial Average today does not mean the same thing as a 300 point drop in 2012. On February 17, 2012, the Dow Jones Industrial Average closed at 12,949. Today it sits just above 26,000. In percentage terms, a 300 drop in 2012 equaled a 2.3% drop in the stock market. If you translate that to where the stock market is today, you would need a 598 point drop in a single day to get that same 2.3% drop. It's just math but we have to remember this when the headlines in the media read:
"The Dow Dropped By 300 Points Today. Traders Are Worried That This Could Be The End Of The Rally?"
Never Hesitate
While I write these articles to help our clients and readers to become better investors and to put important market events into perspective, I have a special note that I want to leave off on for our clients. When you have that feeling of uncertainty, never hesitate to contact me. That quick phone call just to ask, "Mike, should I be worried?" That's what I'm here for. Have a great week everyone!!
About Michael.........
Hi, I’m Michael Ruger. I’m the managing partner of Greenbush Financial Group and the creator of the nationally recognized Money Smart Board blog . I created the blog because there are a lot of events in life that require important financial decisions. The goal is to help our readers avoid big financial missteps, discover financial solutions that they were not aware of, and to optimize their financial future.


Attention Middle Class: The End Is Near
I'm not a fan of conspiracy theories and I'm not a fan of "doom and gloom" articles. However, I feel compelled to write this article because I want people to be aware of a trend that is unfolding right now in our economy. This trend will strengthen over time, we will cheer for it as it's happening, but like many great things in history, it may have an

I'm not a fan of conspiracy theories and I'm not a fan of "doom and gloom" articles. However, I feel compelled to write this article because I want people to be aware of a trend that is unfolding right now in our economy. This trend will strengthen over time, we will cheer for it as it's happening, but like many great things in history, it may have an unintended consequence. I fear that the unintended consequence of this new trend will be the elimination of the U.S. middle class.
More Profits
I’m an investment advisor so I naturally love a strong bull market that results in large investment gains for our clients. The stock market generally goes up when companies are more profitable than the consensus expects. Higher profits equal higher stock prices which equal more wealth for investors. Corporations have become laser-focused on findings new ways to increase profits. This is important because businesses that struggle to make profits and have constant losses are not so successful and will probably end up shutting down in the near future, according to websites like https://www.laraedo.com/signs-that-my-business-is-ripe-for-a-shutdown/. The equation for net profit is easy:
Revenue – Expenses = Net Profit
Let me ask you this question: What is typically a company’s largest expense?
Answer: Payroll. Said another way, the employees. Salaries, benefits, the building to house the employees, training, workers comp, payroll taxes, and the list goes on and on. If you are the owner of a company that makes cell phones and I told you that I have a way that you can make TWICE as many cell phones with HALF the number of employees, what do you think is going to happen to profits? Up!!! In a big way.
The scenario that I just described is not something that might happen in the future, it’s something that is happening right now. Here is the data to support it.
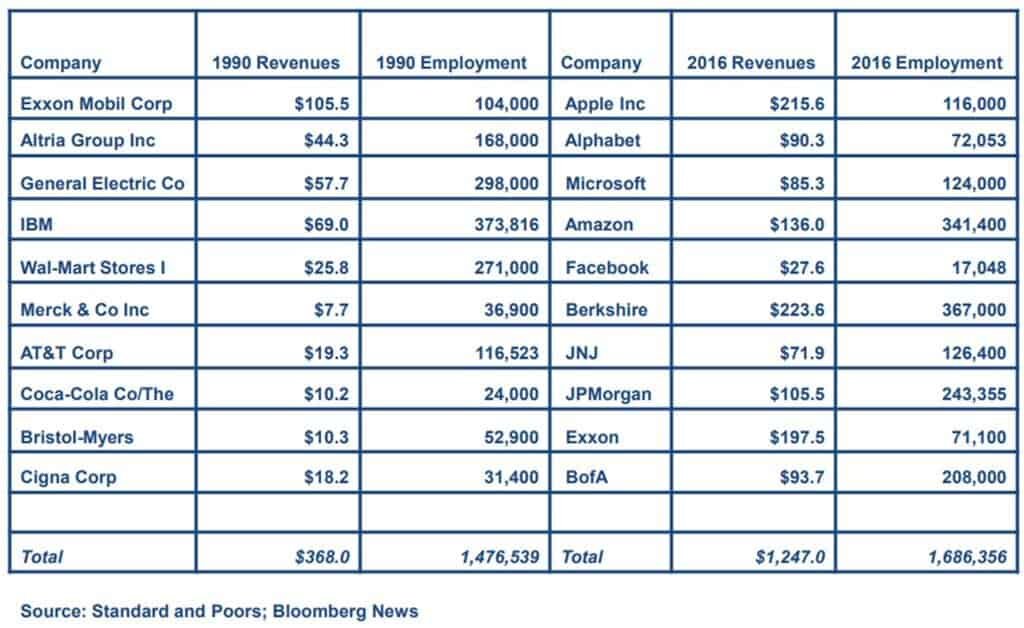
The chart below compares the 10 largest companies in the S&P 500 Index in 1990 to the 10 largest companies in the S&P 500 in 2016. First, you may notice that none of the companies that were the largest in 1990 remained on the list in 2016. But here is the trend that I want to point out. When you look at the 10 largest companies in 1990, they produced $368 Billion dollars of revenue and employed 1.4 Million workers. Fast forward to 2016, the top 10 largest companies produced $1.2 Trillion dollars in revenue and employed about 1.6 Million workers. Now let’s do some quick math, between 1990 and 2016 the gross revenue of the largest 10 companies in the S&P 500 increased by 239% but the number of workers employed by those companies only increased by 14%. Companies are already doing more with less people.
Just when you thought things were going good for the company, I now come to you, the owner of the company, and tell you I have a way to make profits double within the next 3 years. Are you interested? Of course you are. All we have to do is buy these three machines that will replace another 50% of the employees. These machines work 24 hours a day, don’t need health insurance, don’t get sick, and we can move to a smaller building which will reduce rent by 60%. How is that possible? Welcome to the party…..artificial intelligence.
Not A Terminator Movie
What do we think of when we hear the words “artificial intelligence”? Terminators!! Fortunately for us that’s not the artificial intelligence that I’m referring too. But a machine that thinks and learns from its mistakes? The human mind is not as unique as we would like to think it is. Just take a Myers Briggs personality test. You answer 100 questions and then it tells you how you react to things, what annoys you, what your strengths are, how you communicate, and what you have difficulties with. It’s kind of scary as you read the results and realize “Yup. That’s me”
Think about it. Google may know more about you than your spouse. What do you want for Christmas? Your spouse may not know but Google knows all of the items that you looked at over the past 3 months, what items you spent the most time looking at, did you click on the description to read more, and what other items did you look at after you click on the initial item. It tells Google how you search for information. Also Google acknowledges that we all search for things differently and what we are searching for tells Google more about us. Essentially Google learns at little bit more about you every time you search for something via their website.
What about a machine that can respond to questions and it sounds just like a person when it speaks? Oh and it speaks perfect English. No more overseas call centers with people you can’t understand. With most call centers, there are probably 20 questions that represent 80% of all the questions asked. If the machine is unable to answer the question, it automatically routes that call to a living, breathing person. The programmers of the machines are notified when a question triggers a transfer to a live person, they listen to the call, and then update the software to be able to answer the question the next time it is asked. The easy math, this could reduce the number of customer service representatives that the company needs to employ by 80%. Oh and the number of employees will continue to decrease as the machines learn to answer more questions and the software gets more sophisticated.
While a company may go this direction to reduce expenses, we as the consumer will also champion this change. Think about how painful it is to call the cable company. What if I told you that when you call you won’t have to wait on hold, the “person” that you are speaking to will know how to resolve your problem, and you will be off the phone in less than 2 minutes. Time is a valuable commodity to us. Fix my problem and fix it quickly. If a machine can do that better than a real person, be my guest. If companies want it and we as the consumer want it, how fast do you think it’s going to happen?
I Can't Be Replaced By A Machine.....Wrong
While we will cheer how the new A.I. technology saves us time and makes life easier, many of us will have the hubris that “a machine can’t do what I do?”. While a machine may not be able to replace 100% of what you do, could it replace 50%? It’s going to be presented like this, “you know all of those daily tasks that you don’t like to do: paperwork, scanning forms, payroll, and preparing financial reports for the weekly managers meeting. Well you don’t have to do those anymore.” Yes!!!! Oh and more good news you don’t have to train a new employee to complete those tasks and wonder if they are going to leave a year from now and have to train someone else.
Programming a machine to complete a task is not too different from training a new employee. When you hire a new employee many of them may know very little about your industry, they have no idea how your company operates, how to answer tough questions from prospects, etc. You have to train them or “program” them. Then they learn on the job from there. The value of having 20 years of experience is you have seen many difficult situations throughout your career and you learned from your past experiences. The next time the same or similar problem surfaces you know how to react. Normally what you do is you teach those lessons to each new manager and employee over and over again. That takes time. What if you only had to teach that lesson one more time and every new employee already knew how to react in the same tough situation? That’s artificial intelligence.
My point, this trend will not be limited to just manufacturing or customer services. This new technology will eventually impact each of our careers in some way, shape, or form.
3 Stages
I expect this to happen in three stages.
Stage 1: Companies do MORE with only a FEW MORE employees
Stage 2: Companies do MORE with the SAME number of employees
Stage 3: Companies do MORE with LESS employees
We are already through Stage 1 and we are entering Stage 2. How long will it be before we reach stage 3? That’s anyone’s guess. But with most evolution, Stage 1 takes the longest and the following stages evolve more rapidly. If Stage 1 took 16 years, my guess would be that stage 3 will be here a lot sooner than we think.
So What Happens To All Of The Employees?
The million dollar question and I don't know the answer. If I had to guess, the current middle class is going to be divided into two. Half of the middle class is going move up into the "upper class" and the other half will be "unemployed". The level of education will be the dividing line. Companies will continue to do more with less people. The only way to stop it is to tell companies that need to stop trying to be more profitable. Good luck. Our entire economy is built on the premise that you should accumulate as much as you can as fast as you can.
War and Conflict
When I look back in history, major conflicts arise when there is a large deviation between the “Have’s” and the “Have Not’s”. The fancy name that is used today is “income inequality”. When you have a robust middle class, everyone has something to lose if a conflict arises because that conflict generally disrupts the current system, uncertainty prevails, the economy goes into a recession, people lose their job, and they in turn cannot make their mortgage payment.
If instead, a majority of the population is unemployed and they can’t find a job because the jobs don’t exist anymore, that group of individuals has nothing to lose by burning the current system to the ground and rebuilding a new one from the ashes. I know that sounds dark but there is no arguing the gap between the Have’s and the Have Not’s is getting larger. Just look at the labor participation rate:
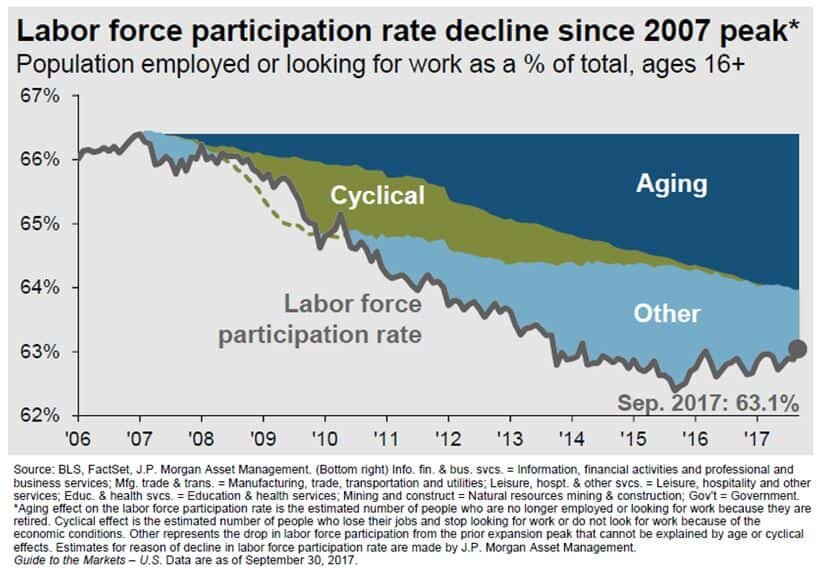
The Labor Participation Rate answers the question, how many people in the U.S. that could be working either are working or are looking for work? If there are individuals who could work, don’t have a job, and stop looking for work, they drop out of the labor force which decrease the labor participation rate because there are less citizens participating on the work force. As you can see in the chart above, in 2006 the labor participation rate was around 66%, and while we continue to experience one of the longest economic expansions of all time, the labor participation rate is still lower now than it was prior to the beginning of the economic recovery. Remember we are in an expansion and it has dropped by about 3%. What do you think will happen when we hit the next recession? While the baby boomer generation has had an impact on these numbers as you can see based on the large percentage of that decrease attributed to an “aging population”. Traditionally when someone retires, the company will promote the person below them and then hire another person to fill there spot. As many of us know, that’s not how it works anymore. Now that key employee retires, the company promotes one person into their role, but instead of hiring a new employee they just redistribute the work to the current staff. If anything, the baby boomer generation moving into retirement has made this transition to “do more with less people” easier on companies because they don’t have to fire anyone.
Tax Reform Will Accelerate The Trend
If you combine tax reform with the current 4.1% employment rate, I would expect this to accelerate the development of artificial intelligence. Companies are going to have cash from the tax savings to reinvest into new technologies which includes artificial intelligence. If the economy continues to grow at its current 2% pace or accelerates, one would expect consumption to increase which increases the demand for products and services. With the unemployment rate at 4.1%, we are already at "full employment". There are not enough qualified workers for companies to hire to meet the increase in demand for their product or service. The answer, let's accelerate the development of artificial intelligence that will allow the company to enter Phase 2 which is "Do MORE with the SAME number of workers".
People Will Cheer
These advances in technology are potentially setting the stage for levels of profitability that companies have only dreamed of. Higher profits traditionally equal higher stock prices. Investors will cheer this!! It may even lead us to the longest economic expansion of all time. In the short term, investors may have a lot to be excited about but we may look back years from now and realize that we were unintentionally cheering for the end of the middle class as we know it.
Again, this article is not meant to be a “dark cloud” or a new conspiracy theory but rather to keep our readers aware of the world that is changing rapidly around us. Like many of the economic challenges that the U.S. economy has experienced in the past, the hazard was in plain view, but investors failed to see it because they got caught up in the moment. When investing, it’s ok to take advantage of short term gains but never lose sight of the big picture.
About Michael.........
Hi, I’m Michael Ruger. I’m the managing partner of Greenbush Financial Group and the creator of the nationally recognized Money Smart Board blog . I created the blog because there are a lot of events in life that require important financial decisions. The goal is to help our readers avoid big financial missteps, discover financial solutions that they were not aware of, and to optimize their financial future.


A Lesson From Bitcoin
I'm not writing this article to predict whether Bitcoin is going to $0 or $50,000. I have no idea whether it's going to go up or down from here. But I have had countless conversations with clients and friends over the past few weeks which starts like this "What do you think about Bitcoin?"My response is, before you make any type of investment, you should

I'm not writing this article to predict whether Bitcoin is going to $0 or $50,000. I have no idea whether it's going to go up or down from here. But I have had countless conversations with clients and friends over the past few weeks which starts like this "What do you think about Bitcoin?"
My response is, before you make any type of investment, you should be able to answer the following questions. If you can't answer these questions with confidence, you probably should not be investing in it.
"Explain It To Me In 30 Seconds"
Investing is as much of an art as it is a science which is why you can ask three different investment advisors about the same investment and get three different answers. While the full analysis of an investment can be complex and require a thorough understanding of markets, equity analysis, and financial reports, seasoned veterans have mastered their craft and have a way of simplifying the process. One of the lessons that I learned from my mentor and that I continue to apply to selecting investments today is "If you can't explain it to me in less than 30 seconds, I don't want to have anything to do with it."Before investing in anything, you should:
Develop an investment thesis
Identify the risks
Identify competitors
Know at what price to sell at
Let's look at each of these items and how they apply to the Bitcoin situation.
Develop an investment thesis
An investment thesis answers the question, why are you committing money to that particular investment? When buying a stock, you try to identify companies that have strong management, good cash flow, a promising new product or service, expanding market share, and a competitive advantage with the expectation that the company will outperform a given benchmark.
“Because I think it will go up” is not an investment thesis. You have to include in your investment thesis items that can be measured. If for example, I decide to invest in a cell phone company because they are expected to expand into China, India, and increase their market share over the next 3 years by 50%. I have identified a clear and measurable reason why I have chosen to invest in that company.
Bitcoin poses a challenge in this sense. When you invest in a company, you are essentially investing in the future cash flow that is expected to be produced by that company. Which is why the price to earnings ratio is often used to determine if a company is “reasonably priced”. Bitcoin is a currency that does not produce future cash flow so what metrics can you build into an investment thesis that will allow you to measure your expected outcome? I have yet to hear a good answer to that question. An “expert” making a prediction that Bitcoin is going to $30,000 is not a great metric to use. Remember, price appreciation is a by product of the improvement of the underlying financial drivers of an investment. If you can’t identify what those financial drivers are, price is irrelevant.
Identify the risks
Before making any investment, you should be able to take out a sheet of paper and list of the risks to your investment thesis. If you don’t know the risks, how do you know when to get out of that investment? In my cell phone company example, I bought that stock because I expected that company to gain 50% of the cell phone market share in China & India over the next 3 years. What are the risks to that investment thesis?
Currency risk: The value of the U.S. dollar increases versus the local currency decreasing profits
Execution risk: They do not successfully execute their strategy. It takes 5 years instead of 3.
Political risk: The Chinese government assumes ownership of the company
Market risk: The global economy goes into a recession
Competitor risk: Another reputable cell phone company enters that market
Management risk: The current CEO leaves the company and the new CEO takes the company in a different direction
Cash flow risk: The company takes on too much debt trying to expand and has to scale back
While everyone goes into a new investment with the hopes and dreams that it is the next Apple, you have to be able to identify what could send your great investment tumbling to the ground.
Can you list all of the risks associated with Bitcoin? It could go to zero but that’s true of any investment. With many new technologies, services, currencies, and medical devices, you have too unfortunately accept the fact that all of the risks associated with that investment are probably not known. It does not necessarily mean it’s a bad investment since most breakthrough technology and products are met with resistance and then uniformly accepted by the masses down the road. But it does imply that the investment comes with a much higher level of risk because a greater number of unknowns exists and you have to be able to live with the fact that it has just as much of a chance of going up by 100% as it does going to zero. While this line of thinking may not completely deter you from making a particular investment, it will hopefully influence the amount that you decide to commit to riskier investments.
Identify Competitors
When identifying competitors, my first question is usually "how large are the barriers to entry into are particular product or market?" The larger the barriers to entry, the longer it takes competitors to catch up to the market leaders. It would seem in the case of Bitcoin, that the barriers to entry for cryptocurrencies are fairly low. I'm already starting to hear the buzz at holiday parties about "ICO's" which stands for Initial Coin Offering. If I were looking to invest in Bitcoin, I would be asking the questions:
Who are the other main stream cryptocurrencies?
Do they have a competitive advantage over Bitcoin?
What would entice someone to switch from Bitcoin to another cryptocurrency?
How large is the cyptocurrency market?
Will regulations eventually come into play and create barriers to entry?
How many people that invested in Bitcoin do you think can answer these questions? My guess is not many. That in itself is risky.
Knowing At What Price To Sell
Of all the investment criteria that I have listed so far, I think this one is the most problematic when it comes to Bitcoin. When making any investment, you have to be able to answer the question: “Based on all of the information that I have today, at what price should I sell it at?” If I own a rental property and it’s fair market value is $250,000 and I collect $15,000 per year in rent, if someone offered me $300,000 to buy my rental property should I sell it? To answer that question, I would map out all of the income that I expect to receive from that property over my lifetime and apply a reasonable appreciation rate of the property value itself. It’s a similar process in evaluating a stock. You are looking at the annual earnings of the company and what you expect those earnings to be in the future. Both of these examples, like most investments, generate future cash flow and have reasonable appreciation rates that can be applied. With Bitcoin, as I mentioned earlier, there is no future cash flow. It’s value right now is being set based on what the next person is willing to buy it for. If one day people wake up and decide I don’t want to buy your Bitcoin or provide you with any good or services in exchange for your Bitcoin, there is nothing there. There are no earnings, there are no products, there are no services, there are no brick and mortar buildings, it’s vapor. With traditional currency, like the U.S. dollar, you have the taxing power and the assets of the United States government confirming that the dollar bill in your hand is worth something
So if I decide to buy Bitcoin today at $14,000 per coin, at what dollar amount should I sell it because it has become overvalued? I have no idea how anyone answers that question at this point. That’s problematic because if I start to make money, the difficult decision is “when do I get out?” When investing, it’s very easy to sell investments that have lost money. It’s emotionally much more difficult to sell your winners. So again, if I buy Bitcoin today and it goes to $30,000, do I sell it? Does it keep going to $50,000? I have absolutely nothing to based that on and that’s a problem.
Remember The Tulips
The single most important take away from this articles is "make sure you understand what you are investing in". If you can't explain it in less than 30 seconds, you probably should not be investing in it. Specific to Bitcoin, I use the saying, history does not repeat itself but it does rhyme. Some of the rhyming took place in the 1600's in the form of the Tulip bubble. In the Netherlands, during the Tulip mania, the cost of a tulip equaled to the cost of a house. Don't believe it? Just take a stroll down history lane. Here's the article: Tulip Mania
About Michael.........
Hi, I’m Michael Ruger. I’m the managing partner of Greenbush Financial Group and the creator of the nationally recognized Money Smart Board blog . I created the blog because there are a lot of events in life that require important financial decisions. The goal is to help our readers avoid big financial missteps, discover financial solutions that they were not aware of, and to optimize their financial future.


Watch These Two Market Indicators
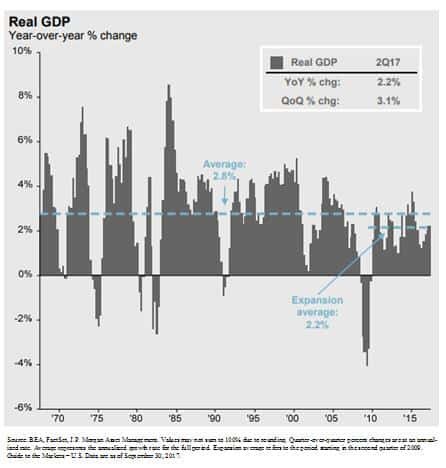
While a roaring economy typically rewards equity investors, the GDP growth rate in the U.S. has continued to grow at that same 2.2% pace that we have seen since the recovery began in March 2009. When you compare that to the GDP growth rates of past economic expansions, some may classify the current growth rate as “sub par”. As in the tale of the
While a roaring economy typically rewards equity investors, the GDP growth rate in the U.S. has continued to grow at that same 2.2% pace that we have seen since the recovery began in March 2009. When you compare that to the GDP growth rates of past economic expansions, some may classify the current growth rate as “sub par”. As in the tale of the tortoise and the hare, sometimes slow and steady wins the race.
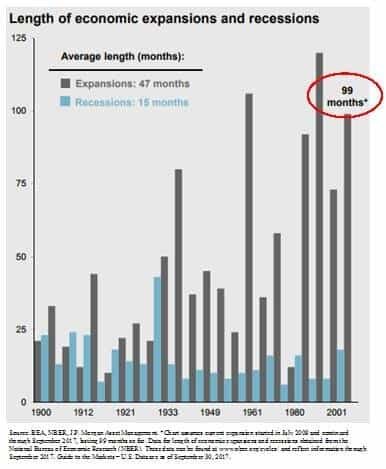
The number one questions on investor’s minds: “It’s been a great rally but are we close to the end?” Referencing the chart below, if you look at the length of the current economic expansion, going back to 1900 we are now witnessing the 3rd longest economic expansion on record which is making investors nervous because as we all know that markets work in cycles.
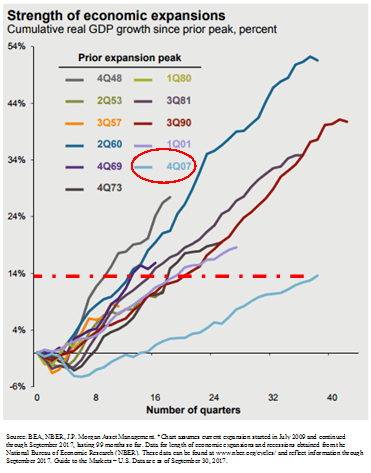
However, if you ignore the “length” of the rally for a moment and look at the “magnitude” of the rally it would seem that total GDP growth of the current economic expansion has been relatively tame compared to some of the economic recoveries in the past. See the chart below. The chart shows evidence that there have been economic rallies in the past that were shorter in duration but greater in magnitude. This may indicate that we still have further to go in the current economic expansion.
What causes big rallies to end?
Looking back at strong economic rallies in the past, the rallies did not die of old age but rather there was an event that triggered the next recession. So we have to be able identify trends within the economic data that would suggest that the economic expansion has ended and it will lead to the next recession.
Watch these two indicators
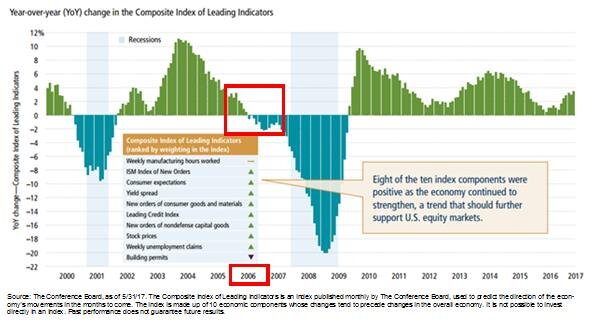
Two of the main indicators that we monitor to determine where we are in the current economic cycle are the Leading Indicators Index and the Yield Curve. History rarely repeats itself but it does rhyme. Look at the chart of the leading indicators index below. The leading indicators index is comprised of multiple economic indicators that are considered “forward looking”, like housing permits. If there are a lot of housing permits being issues, then demand for housing must be strong, and a strong housing market could lead to further economic growth. Look specifically at 2006. The leading indicators went negative in 2006, over a year before the stock market peaked in 2007. This indicator was telling us there was a problem before a majority of investors realized that we were on the doorstep of the recession.
Let’s look at the second key indicator, the yield curve. You will hear a lot about the “slope of the yield curve” in the media. In a healthy economy, long term interest rates are typically higher than short term rates which results in a “positively slopped” yield curve. In other words, when you go to the bank and you have the choice of buying a 2 year CD or a 10 year CD, you would expect to receive a higher interest rate on the 10 year CD because they are locking up your money for 10 years instead of 2.
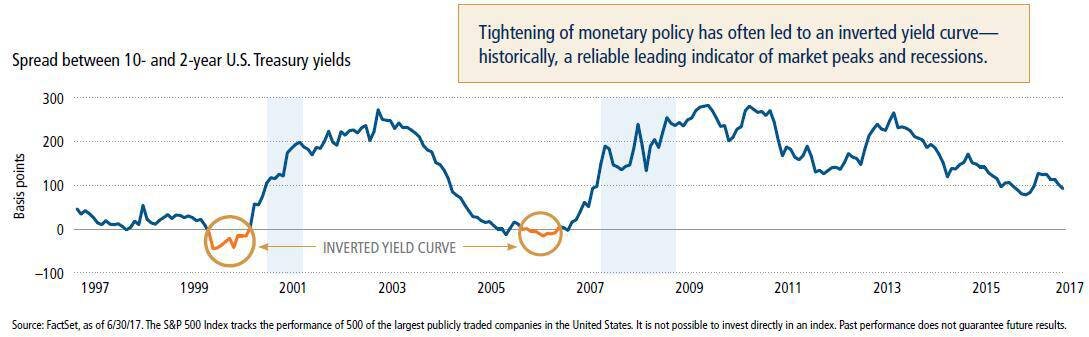
There are periods of time where the interest rate on a 10 year government bond will drop below the interest rate on a 2 year government bond which is considered an “inverted yield curve”. Why does this happen and why would investors by that 10 year bond that is yielding less than the 2 year bond? This happens because bond investors are predicting an economic slowdown in the foreseeable future. They want to lock in the current 10 year interest rate knowing that if the economy goes into a recession that the Fed may begin to lower the Fed Funds Rate which has a more rapid impact on short term rates. It’s a bet that the 2 year bond rate will drop below the 10 year bond rate within the next few years.
If you look at the historical chart of the yield curve above, the yield curve inverted prior to the recession in the early 2000’s and prior to the 2008 recession.
Looking at where we sit today, within the last 6 months the leading indicators index has not only been positive but it’s accelerating and the yield curve is still positively sloped. While we realize that there is not a single indicator that accurately predicts the end of a market cycle, these particular economic indicators have historically been helpful in predicting danger ahead.
There will always be uncertainty in the world. Currently it has taken the form of U.S, politics, tax reforms, geopolitical events, and global monetary policy but it would seem that based on the hard economic data here in the U.S. that our economic expansion that began in March 2009 may still have further to go.
About Michael.........
Hi, I’m Michael Ruger. I’m the managing partner of Greenbush Financial Group and the creator of the nationally recognized Money Smart Board blog . I created the blog because there are a lot of events in life that require important financial decisions. The goal is to help our readers avoid big financial missteps, discover financial solutions that they were not aware of, and to optimize their financial future.

Can I Use My 401K or IRA To Buy A House?
The most difficult part of buying a house is coming up with the down payment. This leads to the question, "Can I access cash in my retirement accounts to help toward the down payment on my house?". The short answer is in most cases, "Yes". The next important questions is "Is it a good idea to take a withdrawal from my retirement account for the down

The most difficult part of buying a house is coming up with the down payment. This leads to the question, "Can I access cash in my retirement accounts to help toward the down payment on my house?". The short answer is in most cases, "Yes". The next important questions is "Is it a good idea to take a withdrawal from my retirement account for the down payment given all of the taxes and penalties that I would have to pay?" This article aims to answer both of those questions and provide you with withdrawal strategies to help you avoid big tax consequences and early withdrawal penalties.
401(k) Withdrawal Options Are Not The Same As IRA's
First you have to acknowledge that different types of retirement accounts have different withdrawal options available. The withdrawal options for a down payment on a house from a 401(k) plan are not the same a the withdrawal options from a Traditional IRA. There is also a difference between Traditional IRA's and Roth IRA's.
401(k) Withdrawal Options
There may be loan or withdrawal options available through your employer sponsored retirement plan. I specifically say "may" because each company's retirement plan is different. You may have all or none of the options available to you that will be presented in this article. It all depends on how your company's 401(k) plan is designed. You can obtain information on your withdrawal options from the plan's Summary Plan Description also referred to as the "SPD".
Taking a 401(k) loan.............
The first option is a 401(k) loan. Some plans allow you to borrow 50% of your vested balance in the plan up to a maximum of $50,000 in a 12 month period. Taking a loan from your 401(k) does not trigger a taxable event and you are not hit with the 10% early withdrawal penalty for being under the age of 59.5. 401(k) loans, like other loans, change interest but you are paying that interest to your own account so it is essentially an interest free loan. Typically 401(k) loans have a maximum duration of 5 years but if the loan is being used toward the purchase of a primary residence, the duration of the loan amortization schedule can be extended beyond 5 years if the plan's loan specifications allow this feature.
Note of caution, when you take a 401(k) loan, loan payments begin immediately after the loan check is received. As a result, your take home pay will be reduced by the amount of the loan payments. Make sure you are able to afford both the 401(k) loan payment and the new mortgage payment before considering this option.
The other withdrawal option within a 401(k) plan, if the plan allows, is a hardship distribution. As financial planners, we strongly recommend against hardship distributions for purposes of accumulating the cash needed for a down payment on your new house. Even though a hardship distribution gives you access to your 401(k) balance while you are still working, you will get hit with taxes and penalties on the amount withdrawn from the plan. Unlike IRA's which waive the 10% early withdrawal penalty for first time homebuyers, this exception is not available in 401(k) plans. When you total up the tax bill and the 10% early withdrawal penalty, the cost of this withdrawal option far outweighs the benefits.
If You Have A Roth IRA.......Read This.....
Roth IRA's can be one of the most advantageous retirement accounts to access for the down payment on a new house. With Roth IRA's, you make after tax contributions to the account, and as long as the account has been in existence for 5 years and you are over the age of 59� all of the earnings are withdrawn from the account 100% tax free. If you withdraw the investment earnings out of the Roth IRA before meeting this criteria, the earnings are taxed as ordinary income and a 10% early withdrawal penalty is assessed on the earnings portion of the account.
What very few people know is if you are under the age of 59� you have the option to withdraw just your after-tax contributions and leave the earnings in your Roth IRA. By doing so, you are able to access cash without taxation or penalty and the earnings portion of your Roth IRA will continue to grow and can be distributed tax free in retirement.
The $10,000 Exclusion From Traditional IRA's.......
Typically if you withdraw money out of your Traditional IRA prior to age 59� you have to pay ordinary income tax and a 10% early withdrawal penalty on the distribution. There are a few exceptions and one of them is the "first time homebuyer" exception. If you are purchasing your first house, you are allowed to withdrawal up to $10,000 from your Traditional IRA and avoid the 10% early withdrawal penalty. You will still have to pay ordinary income tax on the withdrawal but you will avoid the early withdrawal penalty. The $10,000 limit is an individual limit so if you and your spouse both have a traditional IRA, you could potentially withdrawal up to $20,000 penalty free.
Helping your child to buy a house..........
Here is a little known fact. You do not have to be the homebuyer. You can qualify for the early withdrawal exemption if you are helping your spouse, child, grandchild, or parent to buy their first house.
Be careful of the timing rules..........
There is a very important timing rule associated with this exception. The closing must take place within 120 day of the date that the withdrawal is taken from the IRA. If the closing happens after that 120 day window, the full 10% early withdrawal penalty will be assessed. There is also a special rollover rule for the first time homebuyer exemption which provides you with additional time to undo the withdrawal if need be. Typically with IRA's you are only allowed 60 days to put the money back into the IRA to avoid taxation and penalty on the IRA withdrawal. This is called a "60 Day Rollover". However, if you can prove that the money was distributed from the IRA with the intent to be used for a first time home purchase but a delay or cancellation of the closing brought you beyond the 60 day rollover window, the IRS provides first time homebuyers with a 120 window to complete the rollover to avoid tax and penalties on the withdrawal.
Don't Forget About The 60 Day Rollover Option
Another IRA withdrawal strategy that is used as a “bridge solution” is a “60 Day Rollover”. The 60 Day Rollover option is available to anyone with an IRA that has not completed a 60 day rollover within the past 12 months. If you are under the age of 59.5 and take a withdrawal from your IRA but you put the money back into the IRA within 60 days, it’s like the withdrawal never happened. We call it a “bridge solution” because you have to have the cash to put the money back into your IRA within 60 days to avoid the taxes and penalty. We frequently see this solution used when a client is simultaneously buying and selling a house. It’s often the intent that the seller plans to use the proceeds from the sale of their current house for the down payment on their new house. Unfortunately due to the complexity of the closing process, sometimes the closing on the new house will happen prior to the closing on the current house. This puts the homeowner in a cash strapped position because they don’t have the cash to close on the new house.
As long as the closing date on the house that you are selling happens within the 60 day window, you would be able to take a withdrawal from your IRA, use the cash from the IRA withdrawal for the closing on their new house, and then return the money to your IRA within the 60 day period from the house you sold. Unlike the “first time homebuyer” exemption which carries a $10,000 limit, the 60 day rollover does not have a dollar limit.
About Michael.........
Hi, I’m Michael Ruger. I’m the managing partner of Greenbush Financial Group and the creator of the nationally recognized Money Smart Board blog . I created the blog because there are a lot of events in life that require important financial decisions. The goal is to help our readers avoid big financial missteps, discover financial solutions that they were not aware of, and to optimize their financial future.