
Advanced Tax Strategies For Inherited IRA's
Inherited IRA’s can be tricky. There are a lot of rules surrounding;
Establishment and required minimum distribution (“RMD”) deadlines
Options available to spouse and non-spouse beneficiaries
Strategies for deferring required minimum distributions
Special 60 day rollover rules for inherited IRA’s

Inherited IRA’s can be tricky. There are a lot of rules surrounding;
Establishment and required minimum distribution (“RMD”) deadlines
Options available to spouse and non-spouse beneficiaries
Strategies for deferring required minimum distributions
Special 60 day rollover rules for inherited IRA’s
Establishment Deadline
If the decedent passed away prior to December 31, 2019, as a non-spouse beneficiary you have until December 31st of the year following the decedent’s death to establish an inherited IRA, rollover the balance into that IRA, and begin taking RMD’s based your life expectancy. If you miss that deadline, you are locked into distribution the full balance with a 10 year period.
If the decedent passed away January 1, 2020 or later, with limited exceptions, the inherited IRA rollover option with the stretch option is no longer available to non-spouse beneficiaries.
RMD Deadline - Decedent Passed Away Prior to 12/31/19
If you successfully establish an inherited IRA by the December 31st deadline, if you are non-spouse beneficiary, you will be required to start taking a “required minimum distribution” based on your own life expectancy in the calendar year following the decedent’s date of death.
Here is the most common RMD mistake that is made. The beneficiary forgets to take an RMD from the IRA in the year that the decedent passes away. If someone passes away toward the beginning of the year, there is a high likelihood that they did not take the RMD out of their IRA for that year. They are required to do so and the RMD amount is based on what the decedent was required to take for that calendar year, not based on the life expectancy of the beneficiary. A lot of investment providers miss this and a lot of beneficiaries don’t know to ask this question. The penalty? A lovely 50% excise tax by the IRS on the amount that should have been taken.
Distribution Options Available To A Spouse
If you are the spouse of the decedent you have three distribution options available to you:
Take a cash distribution
Rollover the balance to your own IRA
Rollover the balance to an Inherited IRA
Cash distributions are treated the same whether you are a spouse or non-spouse beneficiary. You incur income tax on the amounts distributed but you do not incur the 10% early withdrawal penalty regardless of age because it’s considered a “death distribution”. For example, if the beneficiary is 50, normally if distributions are taken from a retirement account, they get hit with a 10% early withdrawal penalty for not being over the age of 59½. For death distributions to beneficiaries, that 10% penalty is waived.
#1 Mistake Made By Spouse Beneficiaries
This exemption of the 10% early withdrawal penalty leads me to the number one mistake that we see spouses make when choosing from the three distribution options listed above. The spouse has a distribution option that is not available to non-spouse beneficiaries which is the ability to rollover the balance to their own IRA. While this is typically viewed as the easiest option, in many cases, it is not the most ideal option. If the spouse is under 59½, they rollover the balance to their own IRA, if for whatever reason they need to access the funds in that IRA, they will get hit with income taxes AND the 10% early withdrawal penalty because it’s now considered an “early distribution” from their own IRA.
Myth: Spouse Beneficiaries Have To Take RMD’s From Inherited IRA’s
Most spouse beneficiaries make the mistake of thinking that by rolling over the balance to their own IRA instead of an Inherited IRA they can avoid the annual RMD requirement. However, unlike non-spouse beneficiaries which are required to take taxable distributions each year, if you are the spouse of the decedent you do not have to take RMD’s from the inherited IRA unless your spouse would have been age 70 ½ if they were still alive. Wait…..what?
Let me explain. Let’s say there is a husband age 50 and a wife age 45. The husband passes away and the wife is the sole beneficiary of his retirement accounts. If the wife rolls over the balance to an Inherited IRA, she will avoid taxes and penalties on the distribution, and she will not be required to take RMD’s from the inherited IRA for 20 years, which is the year that their deceased spouse would have turned age 70 ½. This gives the wife access to the IRA if needed prior to age 59 ½ without incurring the 10% penalty.
Wait, It Gets Better......
But wait, since the wife was 5 years young than the husband, wouldn’t she have to start taking RMD’s 5 years sooner than if she just rolled over the balance to her own IRA? If she keeps the balance in the Inherited IRA the answer is “Yes” but here is an IRA secret. At any time, a spouse beneficiary is allowed to rollover the balance in their inherited IRA to their own IRA. So in the example above, the wife in year 19 could rollover the balance in the inherited IRA to her own IRA and avoid having to take RMD’s until she reaches age 70½. The best of both worlds.
Spouse Beneficiary Over Age 59½
If the spouse beneficiary is over the age of 59½ or you know with 100% certainty that the spouse will not need to access the IRA assets prior to age 59 ½ then you can simplify this process and just have them rollover the balance to their own IRA. The 10% early withdrawal penalty will never be an issue.
Non-Spouse Beneficiary Options
As mentioned above, the distribution options available to non-spouse beneficiaries were greatly limited after the passing of the SECURE ACT by Congress on December 19, 2019. For most individuals that inherit retirement accounts after December 31, 2019, they will now be subject to the new "10 Year Rule" which requires non-spouse beneficiary to completely deplete the retirement account 10 years following the year of the decedents death.
For more on the this change and the options available to Non-Spouse beneficiaries in years 2020 and beyond, please read the article below:
60 Day Rollover Mistake
There is a 60 day rollover rule that allows the owner of an IRA to take a distribution from an IRA and if the money is deposited back into the IRA within 60 days, it’s like the distribution never happened. Each taxpayer is allowed one 60 day rollover in a 12 month period. Think of it as a 60 day interest free loan to yourself.
Inherited IRA’s are not eligible for 60 day rollovers. If money is distributed from the Inherited IRA, the rollover back into the IRA will be disallowed, and the individual will have to pay taxes on the amount distributed.


About Michael……...
Hi, I’m Michael Ruger. I’m the managing partner of Greenbush Financial Group and the creator of the nationally recognized Money Smart Board blog . I created the blog because there are a lot of events in life that require important financial decisions. The goal is to help our readers avoid big financial missteps, discover financial solutions that they were not aware of, and to optimize their financial future.


The Accountant Put The Owner’s Kids On Payroll And Bomb Shelled The 401(k) Plan
The higher $12,000 standard deduction for single filers has produced an incentive in some cases for business owners to put their kids on the payroll in an effort to shift income out of the owner’s high tax bracket into the children’s lower tax bracket. However, there was a non-Wojeski accountant that advised his clients not only to put his kids on the

Big Issue
The higher $15,000 standard deduction for single filers has produced an incentive in some cases for business owners to put their kids on the payroll in an effort to shift income out of the owner’s high tax bracket into the children’s lower tax bracket. However, there was a non-Wojeski accountant who advised his clients not only to put their kids on the payroll but also to have their children put all of that W2 compensation in the company’s 401(k) plan as a Roth deferral.
At first look it would seem to be a dynamite tax strategy but this strategy blew up when the company got their year end discrimination testing back for the 401(k) plan and all of the executives, including the owner, were forced to distribute their pre-tax deferrals from the plan due to failed discrimination testing. It created a huge unexpected tax liability for the owners and all of the executives, completely defeating the tax benefit of putting the kids on payroll. Not good!!
Why This Happened
If your client sponsors a 401(k) plan and they are not a “safe harbor plan”, then each year the plan is subject to “discrimination testing”. This discrimination testing is to ensure that the owners and “highly compensated employees” are not getting an unfair level of benefits in the 401(k) plan compared to the rest of the employees. They look at what each employee contributes to the plan as a percent of their total compensation for the year. For example, if you make $3,000 in employee deferrals and your W2 comp for the year is $60,000, your deferral percentage is 5%.
They run this calculation for each employee and then they separate the employees into two groups: “Highly Compensated Employees” (HCE) and “Non-Highly Compensation Employees” (NHCE). A highly compensated employee is any employee that in 2025:
is a 5% or more owner, or
Makes $160,000 or more in compensation
They put the employees in their two groups and take an average of each group. In most cases, the HCE’s average cannot be more than 2% higher than the NHCE average. If it is, then the HCE’s get pre-tax money kicked back to them out of the 401(k) plan that they have to pay tax on. It really ticks off the HCE’s when this happens because it’s an unexpected tax bill.
Little Known Attribution Rule
ATTRIBUTION RULE: Even though a child of an owner may not be a 5%+ owner or make more than $160,000 in compensation, they are automatically considered an HCE because they are related to the owner of the business. So in the case that I referred above, the accountant had the client pay the child $14,000 and defer $14,000 into the 401(k) plan as a Roth deferral making their deferral percentage 100% of compensation. That brought the average for the HCE way way up and caused the plan fail testing.
To make matters worse, when 401(k) refunds happen to the HCE’s they do not go back to the person that deferred the highest PERCENTAGE of pay, they go to the person that deferred the largest DOLLAR AMOUNT which was the owner and the other HCE’s that deferred over $18,000 in the plan each.
How To Avoid This Mistake
Before advising a client to put their children on payroll and having them defer that money into the 401(k) plan, ask them these questions:
Does your company sponsor a 401(k) plan?
If yes, is your plan a “safe harbor 401(k) plan?
If the company sponsors a 401(k) plan AND it’s a safe harbor plan, you are in the clear with using this strategy because there is no discrimination testing for the employee deferrals.
If the company sponsors a 401(k) plan AND it’s NOT a safe harbor plan, STOP!! The client should either consult with the TPA (third party administrator) of their 401(k) plan to determine how their kids deferring into the plan will impact testing or put the kids on payroll but make sure they don’t contribute to the plan.
Side note, if the company sponsors a Simple IRA, you don’t have to worry about this issue because Simple IRA’s do not have discrimination testing. The children can defer into the retirement plan without causing any issues for the rest of the HCE’s.
About Michael……...
Hi, I’m Michael Ruger. I’m the managing partner of Greenbush Financial Group and the creator of the nationally recognized Money Smart Board blog . I created the blog because there are a lot of events in life that require important financial decisions. The goal is to help our readers avoid big financial missteps, discover financial solutions that they were not aware of, and to optimize their financial future.


Percentage of Pay vs Flat Dollar Amount
Enrolling in a company retirement plan is usually the first step employees take to join the plan and it is important that the enrollment process be straight forward. There should also be a contact, i.e. an advisor (wink wink), who can guide the employees through the process if needed. Even with the most efficient enrollment process, there is a lot of

Retirement Contributions - Percentage of Pay vs Flat Dollar Amount
Enrolling in a company retirement plan is usually the first step employees take to join the plan and it is important that the enrollment process be straight forward. There should also be a contact, i.e. an advisor (wink wink), who can guide the employees through the process if needed. Even with the most efficient enrollment process, there is a lot of information employees must provide. Along with basic personal information, employees will typically select investments, determine how much they’d like to contribute, and document who their beneficiaries will be. This post will focus on one part of the contribution decision and hopefully make it easier when you are determining the appropriate way for you to save.
A common question you see on the investment commercials is “What’s Your Number”? Essentially asking how much do you need to save to meet your retirement goals. This post isn’t going to try and answer that. The purpose of this post is to help you decide whether contributing a flat dollar amount or a percentage of your compensation is the better way for you to save.
As we look at each method, it may seem like I favor the percentage of compensation because that is what I use for my personal retirement account but that doesn’t mean it is the answer for everyone. Using either method can get you to “Your Number” but there are some important considerations when making the choice for yourself.
Will You Increase Your Contribution As Your Salary Increases?
For most employees, as you start to earn more throughout your working career, you should probably save more as well. Not only will you have more money coming in to save but people typically start spending more as their income rises. It is difficult to change spending habits during retirement even if you do not have a paycheck anymore. Therefore, to have a similar quality of life during retirement as when you were working, the amount you are saving should increase.
By contributing a flat dollar, the only way to increase the amount you are saving is if you make the effort to change your deferral amount. If you do a percentage of compensation, the amount you save should automatically go up as you start to earn more without you having to do anything.
Below is an example of two people earning the same amount of money throughout their working career but one person keeps the same percentage of pay contribution and the other keeps the same flat dollar contribution. The percentage of pay person contributes 5% per year and starts at $1,500 at 25. The flat dollar person saves $2,000 per year starting at 25.
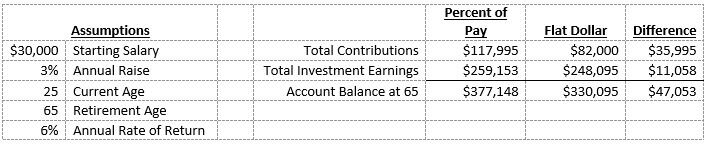
The percentage of pay person has almost $50,000 more in their account which may result in them being able to retire a full year or two earlier.
A lot of participants, especially those new to retirement plans, will choose the flat dollar amount because they know how much they are going to be contributing each pay period and how that will impact them financially. That may be useful in the beginning but may harm someone over the long term if changes aren’t made to the amount they are contributing. If you take the gross amount of your paycheck and multiply that amount by the percent you are thinking about contributing, that will give you close to, if not the exact, amount you will be contributing to the plan. You may also be able to request your payroll department to run a quick projection to show the net impact on your paycheck.
There are a lot of factors to take into consideration to determine how much you need to be saving to meet your retirement goals. Simply setting a percentage of pay and keeping it the same your entire working career may not get you all the way to your goal but it can at least help you save more.
Are You Maxing Out?
The IRS sets limits on how much you can contribute to retirement accounts each year and for most people who max out it is based on a dollar limit. For 2024, the most a person under the age of 50 can defer into a 401(k) plan is $23,000. If you plan to max out, the fixed dollar contribution may be easier to determine what you should contribute. If you are paid weekly, you would contribute approximately $442.31 per pay period throughout the year. If the IRS increases the limit in future years, you would increase the dollar amount each pay period accordingly.
Company Match
A company match as it relates to retirement plans is when the company will contribute an amount to your retirement account as long as you are eligible and are contributing. The formula on how the match is calculated can be very different from plan to plan but it is typically calculated based on a dollar amount or a percentage of pay. The first “hurdle” to get over with a company match involved is to put in at least enough money out of your paycheck to receive the full match from the company. Below is an example of a dollar match and a percent of pay match to show how it relates to calculating how much you should contribute.
Dollar for Dollar Match Example
The company will match 100% of the first $1,000 you contribute to your plan. This means you will want to contribute at least $1,000 in the year to receive the full match from the company. Whether you prefer contributing a flat dollar amount or percentage of compensation, below is how you calculate what you should contribute per pay period.
Flat Dollar – if you are paid weekly, you will want to contribute at least $19.23 ($1,000 / 52 weeks = $19.23). Double that amount to $38.46 if you are paid bi-weekly.
Percentage of Pay – if you make $30,000 a year, you will want to contribute at least 3.33% ($1,000 / $30,000).
Percentage of Compensation Match Example
The company will match 100% of every dollar up to 3% of your compensation.
Flat Dollar – if you make $30,000 a year and are paid weekly, you will want to contribute at least $17.31 ($30,000 x 3% = $900 / 52 weeks = $17.31). Double that amount to $34.62 if you are paid bi-weekly.
Percentage of Pay – no matter how much you make, you will want to contribute at least 3%.
If the match is based on a percentage of pay, not only is it easier to determine what you should contribute by doing a percent of pay yourself, you also do not have to make changes to your contribution amount if your salary increases. If the match is up to 3% and you are contributing at least 3% as a percentage of pay, you know you should receive the full match no matter what your salary is.
If you do a flat dollar amount to get the 3% the first year, when your salary increases you will no longer be contributing 3%. For example, if I set up my contributions to contribute $900 a year, at a salary of $30,000 I am contributing 3% of my compensation (900 / 30,000) but at a salary of $35,000 I am only contributing 2.6% (900 / 35,000) and therefore not receiving the full match.
Note: Even though in these examples you are receiving the full match, it doesn’t mean it is always enough to meet your retirement goals, it is just a start.
In summary, either the flat dollar or percentage of pay can be effective in getting you to your retirement goal but knowing what that goal is and what you should be saving to get there is key.

About Rob……...
Hi, I’m Rob Mangold. I’m the Chief Operating Officer at Greenbush Financial Group and a contributor to the Money Smart Board blog. We created the blog to provide strategies that will help our readers personally, professionally, and financially. Our blog is meant to be a resource. If there are questions that you need answered, please feel free to join in on the discussion or contact me directly.


Will There Be A Santa Claus Rally This Year?
Going back 120 years, December has traditionally been a very good month for the stock market. Within the last 120 years the S&P 500 has been positive in December 73% of the time. The Russell 2000, which is the index for small cap stocks, has been up 87% of the time in December. This boost in the final month of the year is known to traders as the

Going back 120 years, December has traditionally been a very good month for the stock market. Within the last 120 years the S&P 500 has been positive in December 73% of the time. The Russell 2000, which is the index for small cap stocks, has been up 87% of the time in December. This boost in the final month of the year is known to traders as the “Santa Claus Rally”. Should investors expect a Santa Claus rally in 2018 given the recent sell off in the markets? The answer may hinge on the results of the Federal Reserve Meeting on December 19th.
The Fed Decision
The fate of the Santa Claus rally may very well be in the hands of the Federal Reserve Committee this year. The Committee’s decision regarding the Fed Fund Rate could either cause the market to rally if the Fed decides to keep rates unchanged or it could push the markets lower if they decide to move forward with the anticipated quarter point rate hike. The Fed has a really tough decision to make this year. The goal of the Fed is to keep interest rates at a level that promotes full employment and a target inflation rate of 2%. In periods of economic expansion, it’s the Fed’s job to make sure the economy does not overheat which in turn could lead to prices of goods and services in the U.S. spiraling out of control.
Over the past few years, the U.S. economy has continued to expand and the Fed has been raising rates in quarter point increments. A very slow pace by historic standards. The Fed has already raised the Fed Funds Rate three times in 2018. What are the chances that the Fed raises rates again in December?
Solid Employment & Inflation In Check
The good news is there is not a lot of pressure for the Fed to raise rates in December. As of October, the unemployment rate sits at 3.7% and the employment data that we have seen throughout November has been strong. Historically, a strong job market usually results in higher wages for employees which is the main driver of inflation. So in the current economic environment, the Fed’s main focus is keeping inflation within its 2% target range. The Fed’s measuring stick for the rate of inflation is the Personal Consumption Expenditures Index. Otherwise known as the “PCE”.
There is a “Headline PCE” and a “Core PCE”. The Core PCE excludes prices for food and energy which is the Fed’s main barometer. Why does the Fed use Core PCE? Food and Energy prices can fluctuate significantly over short periods of time which can distort the results of the PCE index.
Below is a chart of both the Headline PCE and the Core PCE:
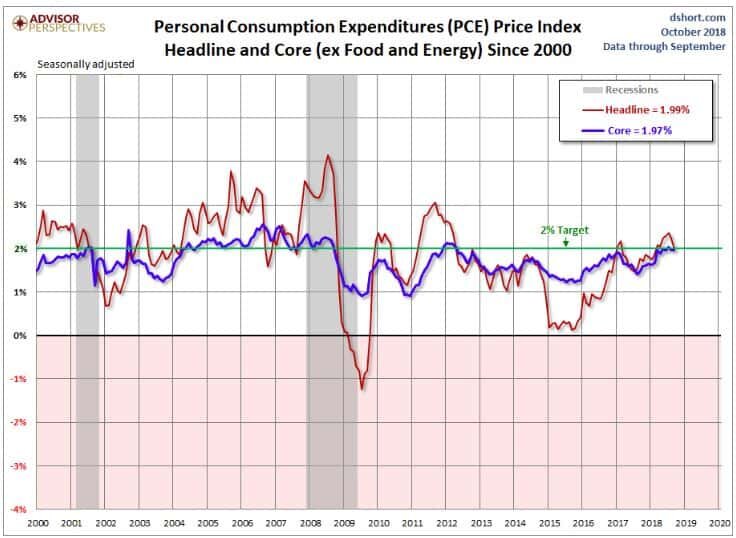
As you can see in the chart, the blue line that represents the Core PCE is right below the Fed’s 2% target. The PCE index is reported monthly and in October the PCE came in at a year-over-year change of 1.97%. Also you will see in the chart, due to the drop in the price of oil over the past two months, the Headline PCE is also dropping. While Headline PCE is not the Fed’s main measuring stick, there does seem to be a correlation between Headline PCE and Core PCE. It makes sense because regardless of the price of the product that you are taking a sample of, that product needs to be transported from the producer to the end user, and that transportation cost, which is largely influenced by the price of oil, will have an impact on the price of product within the Core PCE index.
This is good news for the stock market going into the December Fed meeting. With the Core PCE running just below the Fed’s target 2% rate and the Headline PCE declining, there is not a big push for the Fed to raise the Fed Funds Rate in December. I would even make the argument that raising the Fed Funds Rate in December would be a mistake.
The Fed & The Stock Market
The Fed is not a slave to the stock market. It’s not the Fed’s job to make sure the stock market continues to go up. Just because the stock market has experienced a large sell off over the past two months does not mean that the Fed will come to the market’s rescue and not raise rates. But remember, the Fed’s job is to keep the U.S. economy at full employment and keep inflation in check. Since inflation remains in check, it would seem that the prudent decision would be for the Fed to pause in December. If the Fed decides to raise rates in December, I have a difficult time understanding the catalyst for that decision.
Drivers Of The Recent Sell Off
It’s been a frustrating year for investors. Over the past 7 weeks, the U.S. large cap index, mid cap index, and small cap index have forfeited all of their gains for the year. International equity markets have been crushed this year. In a year like this, normally investors could turn to the bond portion of their portfolio for some support but that has not been the case this year either. The Barclays US Aggregate Bond index is down 2.38% year-to-date in 2018. It’s been a return drought this year with a double dose of volatility.
While the rapid rise in interest rates at the beginning of October may have triggered the market sell off, the downturn has been sustained by revisions to the forward guidance offered by corporations within their third quarter earnings report. While it has been another solid quarter of earnings for U.S. corporations, many of the companies that have been leading the bull market rally revised their forward earnings guidance down for the next few quarters. U.S. corporations seem to be embracing the uncertainty created by the trade wars and the tight labor market going into 2019.
It’s important to understand that as of today corporate earnings have not fallen short of expectations. As of November 14, 2018, 456 of the 500 companies in the S&P 500 had reported 3rd quarter earnings. 77.6% of those companies reported earnings above analyst expectations. This is above the long-term average of 64% and in line with the prior four quarter averaging of 77% exceeding expectations.
What really changed was the gross revenue numbers. Of those 456 companies that reported, 60.4% of those companies reported Q3 revenue above analyst expectations. That puts it in-line with the long-term average of 60% but below the average of the prior four quarters at 73%. While the U.S. economy continues to show strength, U.S. corporations have largely built an “earnings buffer” into their forecasts.
Economic Expansions Do Not Die Of Old Age
Everyone is on the lookout for the next recession. Each market sell off that we experience in this prolonged bull market rally makes investors question if they should run for hills. As one would expect, as you enter the later innings of an economic expansion the markets will begin to become more volatile. It’s easy for investors to hold their positions when the markets are going straight up with no volatility like 2017. It’s much more difficult to hold positions when it feels like you’re on a boat, in a storm, in the middle of an ocean. The temptation to try and jump in and out of the market in these volatile market conditions becomes much greater.
It’s very difficult to predict the future direction of the stock market using the recent fluctuations in the stock market as your barometer for future performance. If we look at many of the economic expansions in the past, we historically do not enter recession because the market calls it a day and just decides to go into a downward death spiral. In the past, there was typically a single event or a series of events that caused the economy to go from a period of expansion to a period of contraction. It’s for this reason that during these periods of heightened volatility that we rely heavily on the economic indicators that we track to determine how worried we should really be.
One of the main indicators that we track that I have shown you in previous updates is the Composite of Leading Indicators. It aggregates a number of forward looking economic and market indicators in an effort to provide a measurement of the health of the U.S. economy. See the chart below.
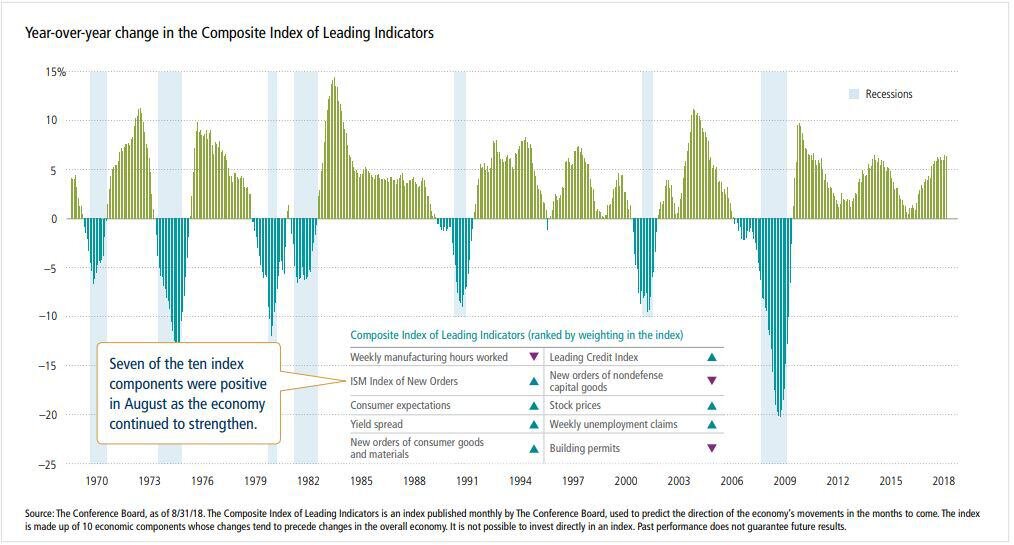
Each of the light blue areas shows when a recession took place going back to 1970. As you will see, in most cases this indicator turned negative before the economy entered a recession. If you look at what this indicator is telling us now, not only is the U.S. economy healthy, but over the past year it has strengthened. If you look at where we are now, there has never been a time since 1970 that this economic indicator has been at its current level, and a recession just shows up out of nowhere 12 months later.
Conclusion
We have no way of knowing what action the Fed will take on December 19th. However, given the tame level of inflation and the 3.7% unemployment rate, we would not be surprised if the Fed pauses at the December meeting which could lead to a health rally for the markets in December. Even if the Fed throws the market a curve ball and moves forward with the quarter point rate hike, while this move may seal the markets hopes of posting a positive return for the 2018 calendar year, the economy is still healthy, the probability of a recession within the next 12 months is still very low, and interest rates, although rising, are still at historically low levels. This economic environment may reward investors that have the discipline to make sound investment decision during these periods of heightened market volatility. The “easy years” are clearly behind us but that does not mean that the economic expansion is over. Have a safe and happy Thanksgiving everyone!!
About Michael……...
Hi, I’m Michael Ruger. I’m the managing partner of Greenbush Financial Group and the creator of the nationally recognized Money Smart Board blog . I created the blog because there are a lot of events in life that require important financial decisions. The goal is to help our readers avoid big financial missteps, discover financial solutions that they were not aware of, and to optimize their financial future.


Navigating Student Loan Repayment Programs
I had the fortunate / unfortunate experience of attending a seminar on the various repayment programs available to young professionals and the parents of these young professionals with student loan debt. I can summarize it in three words: “What a mess!!” As a financial planner, we are seeing firsthand the impact of the mounting student loan debt

I had the fortunate / unfortunate experience of attending a seminar on the various repayment programs available to young professionals and the parents of these young professionals with student loan debt. I can summarize it in three words: “What a mess!!” As a financial planner, we are seeing firsthand the impact of the mounting student loan debt epidemic. Only a few years ago, we would have a handful of young professional reach out to us throughout the year looking for guidance on the best strategy for managing their student loan debt. Within the last year we are now having these conversations on a weekly basis with not only young professionals but the parents of those young professional that have taken on debt to help their kids through college. It would lead us to believe that we may be getting close to a tipping point with the mounting student loan debt in the U.S.
While you may not have student loans yourself, my guess is over next few years you will have a friend, child, nephew, niece, employee, or co-working that comes to you looking for guidance as to how to manage their student loan debt. Why you? Because there are so many repayment programs that have surfaced over the past 10 years and there is very little guidance out there as to how to qualify for those programs, how the programs work, and whether or not it’s a good financial move. So individuals struggling with student loan debt will be looking for guidance from people that have been down this road before. This article is not meant to make you an expert on these programs but is rather meant to provide you with an understanding of the various options that are available to individuals seeking help with managing the student loan debt.
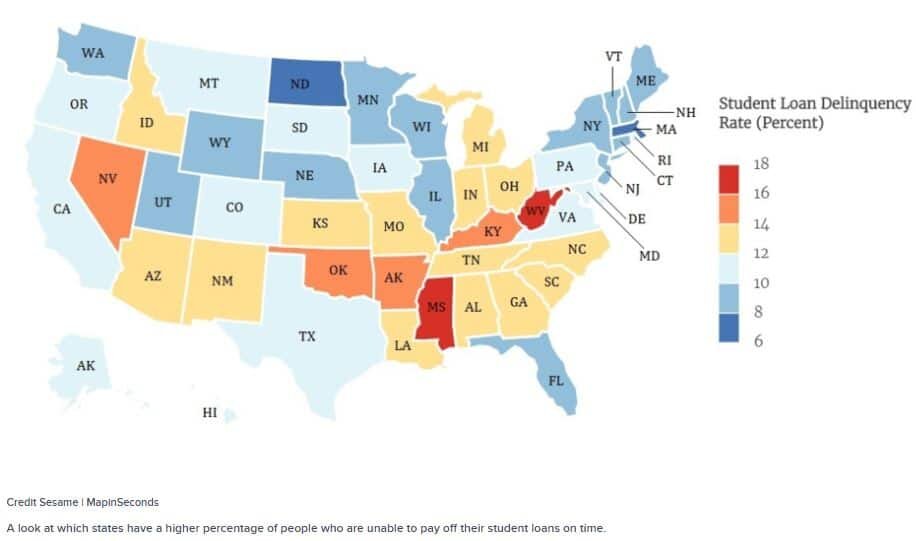
Student Loan Delinquency Rates are Rising
While the $1.8 Trillion dollars in outstanding student loan debt is a big enough issue by itself, the more alarming issue is the rapid rise in the number of loans that are either in delinquency or default. That statistic is 10%. So 1 in every 10 outstanding student loans is either behind in payments or is in default. Even more interesting is we are seeing a concentration of delinquencies in certain states. See the chart below:
Repayment Program Options
Congress in an effort to assist individuals with the repayment of their student loan debt has come out with a long list of repayment programs over the past 10 years. Upfront disclosure, navigating all of the different programs is a nightmare. There is a long list of questions that come up like:
Does a “balanced based” or “income based” repayment plan make the most sense?
What type of loan do you have now?
It is a federal or private loan?
When did you take the loan?
Who do you currently work for?
What is current interest rate on your loan?
What is your income?
Are you married?
Because it’s such an ugly process navigating through these programs and more and more borrowers are having trouble managing their student loan debt, specialists are starting to emerge that know these programs and can help individuals to identify which programs is right for them. Student loan debt management has become its own animal within the financial planning industry.
Understanding The Grace Period
Before we jump into the programs, I want to address a situation that we see a lot of young professional getting caught in. Most students are aware of the 6 month grace period associated with student loan payment plans. The grace period is the 6 month period following graduation from college that no student loan payments are due. It gives graduates an opportunity to find a job before their student loan payments begin. What many borrowers do not realize is the “grace period’ is a one-time benefit. Meaning if you graduate with a 4 year degree, use your grace period, but then decide to go back for a master degree, you can often times put your federal student loans in a “deferred status” while you are obtaining your master degree but as soon as you graduate, there is no 6 month grace period. Those student loan payments begin the day after you graduate because you already used your 6 month grace period after your undergraduate degree. This can put students behind the eight ball right out of the gates.
What Type Of Loan Do You Have?
The first step is you have to determine what type of student loan you have. There are two categories: Federal and Private. The federal loans are student loans either issued or guaranteed by the federal government and they come in three flavors: Direct, FFEL, and Perkins. Private loans are student loans issued by private institutions such as a bank or a credit union.
If you are not sure what type of student loan you have you should visit www.nslds.ed.gov. If you have any type of federal loan it will be listed on that website. You will need to establish a login and it requires a FSA ID which is different than your Federal PIN. If your student loan is not listed on that website, then it’s a private loan and it should be listed on your credit report.
In general, if you have a private loan, you have very few repayment options. If you have federal loans, there are a number of options available to you for repayment.
Parties To The Loan
There are four main parties involved with student loans:
The Lender
The Guarantor
The Servicer
The Collection Agency
The lender is the entity that originates the loan. If you have a “direct loan”, the lender is the Department of Education. If you have FFEL loan, the lender is a commercial bank but the federal government serves as the “Guarantor”, essentially guaranteeing that financial institutions that the loan will be repaid.
Most individuals with student loan debt or Plus loans will probably be more familiar with the name of the loan “Servicer”. The loan servicer is a contractor to the bank or federal government, and their job is to handle the day-to-day operations of the loan. The names of these servicer’s include: Navient, Nelnet, Great Lakes, AES, MOHELA, HESC, OSLA, and a few others.
A collection agency is a third party vendor that is hired to track down payments for loans that are in default.
Balance-Based Repayment Plans
These programs are your traditional loan repayment programs. If you have a federal student loan, after graduate, your loan will need to be repaid over one of the following time periods: 10 years, 25 years, or 30 years with limitations. The payment can either be structure as a fixed dollar amount that does not change for the life of the loan or a “graduated payment plan” in which the payments are lower at the beginning and gradually get larger.
While it may be tempting to select the “graduated payment plan” because it gives you more breathing room early on in your career, we often caution students against this. A lot can happened during your working career. What happens when 10 years from now you get unexpectedly laid off and are out of work for a period of time? Those graduated loan payments may be very high at that point making your financial hardship even more difficult.
Private loan may not offer a graduated payment option. Since private student loans are not regulated by any government agency they get to set all of the terms and conditions of the loans that they offer.
From all of the information that we have absorbed, if you can afford to enroll in a balanced based repayment plan, that is usually the most advantageous option from the standpoint of paying the least interest during the duration of the loan.
Income-Driven Repayment Program
All of the other loan repayment programs fall underneath the “income based payment” category, where your income level determines the amount of your monthly student loan payment within a given year. To qualify for the income based plans, your student loans have to be federal loans. Private loans do not have access to these programs. Many of these programs have a “loan forgiveness” element baked into the program. Meaning, if you make a specified number of payments or payments for a specified number of years, any remaining balance on the student loan is wiped out. For individuals that are struggling with their student loan payments, these programs can offer more affordable options even for larger student loan balances. Also, the income based payment plans are typically a better long-term solution than “deferments” or “forbearance”.
Here is the list of Income-Driven Repayment Programs:
Income-Contingent Repayment (ICR)
Income-Based Repayment (IBR)
Pay-As-You-Earn (PAYE)
Revised Pay-As-You-Earn (REPAYE)
SAVE Program
Each of these programs has a different income formula and a different set of prerequisites for the type of loans that qualify for each program but I will do a quick highlight of each program. If you think there is a program that may fit your circumstances I encourage you to visit https://studentaid.ed.gov/sa/
We have found that borrowers have to do a lot of their own homework when it comes to determining the right program for their personal financial situation. The loan servicers, which you would hope have the information to steer you in the right direction, up until now, have not been the best resource for individuals with student loan debt or parent plus loans. Hence, the rise in the number of specialists in the private sector now serving as fee based consultants.
Income-Contingent Repayment (ICR)
This program is for Direct Loans only. The formula is based on 20% of an individual’s “discretionary income” which is the difference between AGI and 100% of federal poverty level. For a single person household, the 2025 federal poverty level is $15,650 and it changes each year. The formula will result in a required monthly payment based on this data. Once approved you have to renew this program every 12 months. Part of the renewal process in providing your most up to date income data which could change the loan payment amount for the next year of the loan repayment. After a 25-years repayment term, the remaining balance is forgiven but depending on the tax law at the time of forgiveness, the forgiven amount may be taxable. The ICR program is typically the least favorable of the four options because the income formula usually results in the largest monthly payment.
However, this program is one of the few programs that allows Parent PLUS borrowers but they must first consolidate their federal loans via the federal loan consolidation program.
Income-Based Repayment (IBR)
This program is typically more favorable than the ICR program because a lower amount of income is counted toward the required payment. Both Direct and FFEL loans are allowed but Parent Plus Loans are not. The formula takes into account 15% of “discretionary income” which is the difference between AGI and 150% of the federal poverty level. If married it does look at your joint income unless you file separately. Like the ICR program, the loan is forgiven after 25 years and the forgiveness amount may be taxable income.
Pay-As-You-Earn (PAYE)
This plan is typically the most favorable plan for those that qualify. This program is for Direct Loans only. The formula only takes into account 10% of AGI. The forgiveness period is shortened to 20 years. The one drawback is this program is limited to “newer borrowers”. To qualify you cannot have had a federal outstanding loan as of October 1, 2007 and it’s only available for federal student loans issued after October 1, 2011. Joint income is takes into account for married borrowers unless you file taxes separately.
Revised Pay-As-You-Earn (REPAYE)
Same as PAYE but it eliminates the “new borrower” restriction. The formula takes into account 10% of AGI. The only difference is for married borrowers, it takes into account joint income regardless of how you file your taxes. So filing separately does not help. The 20 year forgiveness is the same at PAYE but there is a 25 year forgiveness if the borrow took out ay graduate loans.
Loan Forgiveness Programs
There are programs that are designed specifically for forgive the remaining balance of the loan after a specific number of payment or number of years based on a set criteria which qualifies an individual for these programs. Individuals have to be very careful with “loan forgiveness programs”. While it seems like a homerun having your student loan debt erase, when these individuals go to file their taxes they may find out that the loan forgiveness amount is considered taxable income in the tax year that the loan is forgiven. With this unexpected tax hit, the celebration can be short lived. But not all of the loan forgiveness programs trigger taxation. Here are the three loan forgiveness programs:
Public Service Loan Forgiveness
Teacher Loan Forgiveness
Perkins Loan Forgiveness
Following the same format as above, I will provide you with a quick summary on each of these loan forgiveness programs with links to more information on each one.
Public Service Loan Forgiveness
This program is only for Direct Loans. To qualify for this loan forgiveness program, you must be a full-time employee for a “public service employer”. This could be a government agency, municipality, hospital, school, or even a 501(C)(3) not-for-profit. You must be enrolled in one of the federal repayment plans either balanced-based or income driven. Once you have made 120 payments AFTER October 1, 2007, the remaining balance is forgiven. Also the 120 payments do not have to be consecutive. The good news with this program is the forgiven amount is not taxable income. To enroll in the plan you have to submit the Public Service Loan Forgiveness Employment Certification Form to US Department of Education. See this link for more info: https://studentaid.ed.gov/sa/repay-loans/forgiveness-cancellation/public-service
Teacher Loan Forgiveness
This program is for Federal Stafford loans issued after 1998. You have to teach full-time for five consecutive years in a “low-income” school or educational services agency to qualify for this program. The loan forgiveness amount is capped at either $5,000 or $17,000 based on the subject area that you teach. https://studentaid.ed.gov/sa/repay-loans/forgiveness-cancellation/teacher#how-much
As special note, even though teachers may also be considered “Public Service” employees, you cannot make progress toward the Teacher Loan Forgiveness Program and the Public Service Loan Forgiveness Program at the same time.
To apply for this program, you must submit the Teacher Loan Forgiveness Application to your loan servicer.
Perkins Loan Forgiveness
As the name suggests, this program is only available for Federal Perkins Loans. Also, it’s only available to certain specific full-time professions. You can find the list by clicking on this link: https://studentaid.ed.gov/sa/repay-loans/forgiveness-cancellation/perkins
The Perkins forgiveness program can provide up to 100% forgiveness in 5 years with NO PAYMENTS REQUIRED. To apply for this program, you must complete an application through the school, if they are the lender, or your loan servicer.
Be Careful Consolidating Student Loans
Young professionals have to be very careful when consolidating student loan debt. One of the biggest mistakes that borrowers make without the proper due diligence is consolidating their federal student loans with a private institution to take advantage of a lower interest rate. In some cases, it may be the right move, but as soon as this happens, you are shut out of any options that would have been available to you if you still had federal student loans. Before you go from a federal loan to a private loan, make sure you properly weigh all of your options.
If you already have private loans and you want to consolidate the loans with a different lender to lower interest rates or obtain more favorable repayment terms, there is typically less risk in doing so.
You are allowed to consolidate federal loans within the federal system, but it does not save you any interest. They simply take the weighted average of all the current interest rates on your federal loans to reach the interest rate on your new consolidated federal student loan.
Defaulting On A Student Loan
Defaulting on any type of loan is less than ideal but student loans are a little worse than most loans. Even if you claim bankruptcy, there are very few cases where student loan debt gets discharged in a bankruptcy filing. For private loans, not only does it damage your credit rating but the lender can sue you in state court. Federal loans are not any better. Defaulting on a federal loan will damage your credit score but the federal government can go one step further than private lenders to collect the unpaid debt. They have the power to garnish your wages if you default on a federal loan.
About Michael……...
Hi, I’m Michael Ruger. I’m the managing partner of Greenbush Financial Group and the creator of the nationally recognized Money Smart Board blog . I created the blog because there are a lot of events in life that require important financial decisions. The goal is to help our readers avoid big financial missteps, discover financial solutions that they were not aware of, and to optimize their financial future.

What Happens To My Pension If The Company Goes Bankrupt?
Given the downward spiral that GE has been in over the past year, we have received the same question over and over again from a number of GE employees and retirees: “If GE goes bankrupt, what happens to my pension?” While it's anyone’s guess what the future holds for GE, this is an important question that any employee with a pension should

Over the past few years, we have seen a number of companies go bankrupt that sponsored pension plans for their employees which causes the employees to ask “If my company goes bankrupt, what happens to my pension?” While some employees are aware of the PBGC (Pension Benefit Guarantee Corporation), which is an organization that exists to step in and provide pension benefits to employees if the employer becomes insolvent, very few are aware that the PBGC itself may face insolvency within the next ten years. So, if the company can’t make the pension payments and the PBGC is out of money, are employees left out in the cold?
Pension shortfall
When a company sponsors a pension plan, they are supposed to make contributions to the plan each year to properly fund the plan to meet the future pension payments that are due to the employees. However, if the company is unable to make those contributions or the underlying investments that the pension plan is invested in underperform, it can lead to shortfalls in the funding.
We have seen instances where a company files for bankruptcy and the total dollar amount owed to the pension plan is larger than the total assets of the company. When this happens, the bankruptcy courts may allow the company to terminate the plan and the PBGC is then forced to step in and continue the pension payments to the employees. While this seems like a great system since up until now that system has worked as an effective safety net for these failed pension plans, the PBGC in its most recent annual report is waiving a red flag that it faces insolvency if Congress does not make changes to the laws that govern the premium payments to the PBGC.
What is the PBGC?
The PBGC is a federal agency that was established in 1974 to protect the pension benefits of employees in the private sector should their employer become insolvent. The PBGC does not cover state or government-sponsored pension plans. The number of employees who were plan participants in an insolvent pension plan that now receive their pension payments from the PBGC is daunting. According to the 2017 PBGC annual report, the PBGC “currently provides pension payments to 840,000 participants in 4,845 failed single-employer plans and an additional 63,000 participants across 72 multi-employer plans.”
Wait until you hear the dollar amounts associated with those numbers. The PBGC paid out $5.7 Billion dollars in pension payments to the 840,000 participants in the single-employer plans and $141 Million to the 63,000 participants in the multi-employer plans in 2017.
Where Does The PBGC Get The Money To Pay Benefits?
So where does the PBGC get all of the money needed to make billions of dollars in pension payments to these plan participants? You might have guessed “the taxpayers” but for once that’s incorrect. The PBGC’s operations are financed by premiums payments made by companies in the private sector that sponsor pension plans. The PBGC receive no taxpayer dollars. The corporations that sponsor these pension plans pay premiums to the PBGC each year and the premium amounts are set by Congress.
Single-Employer vs Multi-Employer Plans
The PBGC runs two separate insurance programs: “Single-Employer Program” and “Multi-Employer Program”. It’s important to understand the difference between the two. While both programs are designed to protect the pension benefits of the employees, they differ greatly in the level of benefits guaranteed. The assets of the two programs are also kept separate. If one programs starts to fail, the PBGC is not allowed to shift assets over from the other program to save it.
The single-employer program protects plans that are sponsored by single employers. The PBGC steps in when the employer goes bankrupt or can no longer afford to sponsor the plan. The Single-Employer Program is the larger of the two programs. About 75% of the annual pension payments from the PBGC come from this program. Some examples of single-employer companies that the PBGC has had to step into to make pension payments are United Airlines, Lehman Brothers, and Circuit City.
The Multi-Employer program covers pension plans created and funded through collective bargaining agreements between groups of employers, usually in related industries, and a union. These pension plans are most commonly found in construction, transportation, retail food, manufacturing, and services industries. When a plan runs out of money, the PBGC does not step in and takeover the plan like it does for single-employer plans. Instead, it provides “financial assistance” and the guaranteed amounts of that financial assistants are much lower than the guaranteed amounts offered under the single-employer program. For example, in 2017, the PBGC began providing financial assistance to the United Furniture Workers Pension Fund A (UFW Plan), which covers 10,000 participants.
Maximum Guaranteed Amounts
The million dollar question. What is the maximum monthly pension amount that the PBGC will guarantee if the company or organization goes bankrupt? There are maximum dollar amounts for both the single-employer and multi-employer program. The maximum amounts are indexed for inflation each year and are listed on the PBGC website. To illustrate the dramatic difference between the guarantees associated with the pension pensions in a single-employer plan versus a multi-employer plan; here is an example from the PBGC website based on the 2018 rates.
“PBGC’s guarantee for a 65-year-old in a failed single-employer plan can be up to $89,181 annually, while a participant with 30 years of service in a failed multi-employer plan caps out at $12,870 per year. The multi-employer program guarantee for a participant with only 10 years of service caps out at $4,290 per year.”
It’s a dramatic difference.
For the single-employer program the PBGC provides participants with a nice straight forward benefits table based on your age. Below is a sample of the 2025 chart. However, the full chart with all ages can be found on the PBGC website.

PBGC
Unfortunately, the lower guaranteed amounts for the multi-employer plans are not provided by the PBGC in a nice easy to read table. Instead they provide participant with a formula that is a headache for even a financial planner to sort through. Here is a link to the formula for 2018 on the PBGC website.
PBGC Facing Insolvency In 2025
If the organization guaranteeing your pension plan runs out of money, how much is that guarantee really worth? Not much. If you read the a previous year’s annual report issued by the PBGC (which was painful), at least 20 times throughout the report you will read the phase:
“The Multi-employer Program faces very serious challenges and is likely to run out of money by the end of fiscal year 2025.”
They have placed a 50% probability that the multi-employer program runs out of money by 2025 and a 99% probability that it runs out of money by 2036. Not good. However, as of September of 2024, the Multi-Employer program reported a net positive position, of $2.1 billion.
There is also good news for the Single-Employer Program. As of 2025, even though the Single-Employer Program ran a cumulative deficit in the billions of dollars in previous years, the program now has a net surplus of $54.1 billion.
Difficult Decision For Employees
While participants in Single-Employer plans may be breathing a little easier after reading this article, if the next recession results in a number of large companies defaulting on their pension obligations, the financial health of the PBGC could change quickly without help from Congress. Employees are faced with a one-time difficult decision when they retire. Option one, take the pension payments and hope that the company and PBGC are still around long enough to honor the pension payments. Or option two, elect the lump sum, and rollover then present value of your pension benefit to your IRA while the company still has the money. The right answer will vary on a case by case basis but the projected insolvency of the PBGC’s Multi-employer Program makes that decision even more difficult for employees.
Michael Ruger
About Michael……...
Hi, I’m Michael Ruger. I’m the managing partner of Greenbush Financial Group and the creator of the nationally recognized Money Smart Board blog . I created the blog because there are a lot of events in life that require important financial decisions. The goal is to help our readers avoid big financial missteps, discover financial solutions that they were not aware of, and to optimize their financial future.

Volatility, Market Timing, and Long-Term Investing
For many savers, the objective of a retirement account is to accumulate assets while you are working and use those assets to pay for your expenses during retirement. While you are in the accumulation phase, assets are usually invested and hopefully earn a sufficient rate of return to meet your retirement goal. For the majority,
Volatility, Market Timing, and Long-Term Investing
For many savers, the objective of a retirement account is to accumulate assets while you are working and use those assets to pay for your expenses during retirement. While you are in the accumulation phase, assets are usually invested and hopefully earn a sufficient rate of return to meet your retirement goal. For the majority, these accounts are long-term investments and there are certain investing ideas that should be taken into consideration when managing portfolios. This article will discuss volatility, market timing and their role in long-term retirement accounts.
“Market timing is the act of moving in and out of the market or switching between asset classes based on using predictive methods such as technical indicators or economic data” (Investopedia). In other words, trying to sell investments when they are near their highest and buy investments when they are near their lowest. It is difficult, some argue impossible, to time the market successfully enough to generate higher returns. Especially over longer periods. That being said, by reallocating portfolios and not experiencing the full loss during market downturns, investors could see higher returns. When managing portfolios over longer periods, this should be done without the emotion of day to day volatility but by analyzing greater economic trends.
So far, the stock market in 2018 has been volatile; particularly when compared to 2017. Below are charts of the S&P 500 from 1/1/2018 – 10/21/2018 and the same period for 2017.
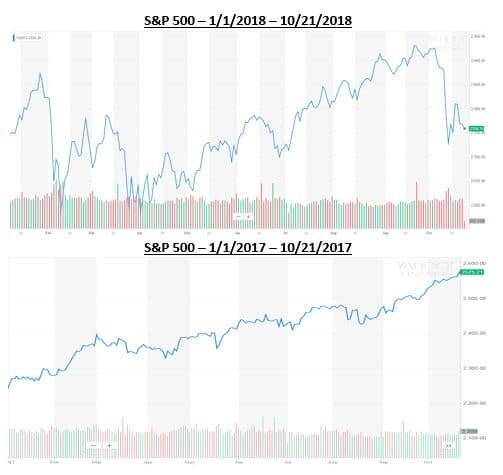
Source: Yahoo Finance. Information has been obtained from sources believed to be reliable and are subject to change without notification.
Based on the two charts above, one could conclude the majority of investors would prefer 2017 100% of the time. In reality, the market averages a correction of over 10% each year and there are years the market goes up and there are years the market goes down. Currently, the volatility in the market has a lot of investors on edge, but when comparing 2018 to the market historically, one could argue this year is more typical than a year like 2017 where the market had very little to no volatility.
Another note from the charts above are the red and green bars on the bottom of each year. The red represent down days in the market and the green represent up days. You can see that even though there is more volatility in 2018 compared to 2017 when the market just kept climbing, both years have a mixture of down days and up days.
A lot of investors become emotional when the market is volatile but even in the midst of volatility and downturns, there are days the market is up. The chart below shows what happens to long-term portfolio performance if investors miss the best days in the market during that period.
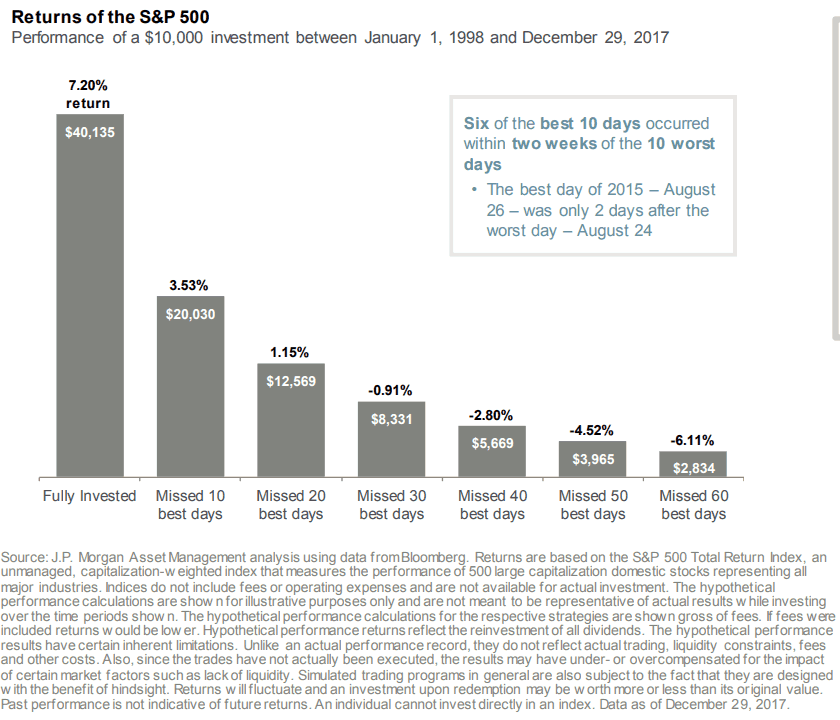
Source: JP Morgan. Information has been obtained from sources believed to be reliable and are subject to change without notification.
Two main takeaways from the illustration above are; 1) missing the best days over a period in the market could have a significant impact on a portfolios performance, and 2) some of the best days in the market over the period analyzed came shortly after the worst days. This means that if people reacted on the worst days and took their money from the market then they likely missed some of the best days.
Market timing is difficult over long periods of time and making drastic moves in asset allocation because of emotional reactions to volatility isn’t always the best strategy for long-term investing. Investors should align their portfolios taking both risk tolerance and time horizon into consideration and make sure the portfolio is updated as each of these change multiple times over longer periods.
When risk tolerance or time horizon do not change, most investors should focus on macro-economic trends rather than daily/weekly/monthly volatility of the market. Not experiencing the full weight of stock market declines could generate higher returns and if data shows the economy may be slowing, it could be a good time to take some “chips off the table”. That being said, looking at past down markets, some of the best days occur shortly after the worst days and staying invested enough to keep in line with your risk tolerance and time horizon could be the best strategy.
It is difficult to take the emotion out of investing when the money is meant to fund your future needs so speaking with your financial consultant to review your situation may be beneficial.
About Rob……...
Hi, I’m Rob Mangold. I’m the Chief Operating Officer at Greenbush Financial Group and a contributor to the Money Smart Board blog. We created the blog to provide strategies that will help our readers personally, professionally, and financially. Our blog is meant to be a resource. If there are questions that you need answered, please feel free to join in on the discussion or contact me directly.

The Stock Market Dropped 800 Points Today. Is This A Warning Sign?
There was a large sell off in the stock market today. The Dow, S&P 500, and Nasdaq all dropped by over 3% in today’s trading session. After a long bull rally, big drops in the stock market often lead investors to the question: “Is this big drop in the market the beginning of something worse to come?” To answer that question, you have to identify what

There was a large sell off in the stock market today. The Dow, S&P 500, and Nasdaq all dropped by over 3% in today’s trading session. After a long bull rally, big drops in the stock market often lead investors to the question: “Is this big drop in the market the beginning of something worse to come?” To answer that question, you have to identify what changed and more importantly what did not change in the economy and the markets over the past two weeks.
Interest Rates Have Spiked
If there is a single indicator or event that we can point to that has triggered the recent sell-off, it would be the dramatic rise in interest rates. Between September 17th and October 10th, the yield on a 10 year government bond went from 3% to 3.23%. Now that may not sound like a big move but interest rates on a 10 year bond moving by 0.23% in less than a month is a big move.
When interest rates go higher, it increases the cost associated with borrowing money. Mortgage News Daily reported yesterday that the average interest rate on a 30-year fixed mortgage is currently at 5% compared to just below 4% a year ago. As interest rates move higher, it may prevent some individuals from being able to finance a mortgage, get a car loan, or it may cause a business to forgo taking that loan to expand their business.
When interest rates rise gradually as they have over the past three years it historically does not prompt a big sell off because those higher rates are slowly integrated into the economy. The yield on the 10 Year Treasury bottomed in May 2016 at 1.46% and has been steadily climbing ever since. In May 2018, the 10 Year Treasury Bond was yielding around 2.80% so it took 2 years from the yield to go up by 1.34% compared to the 0.23% jump that we experience over the past 2 weeks.
Will The Rise In Rates Continue?
We could see a further rise in rates over the next few weeks but at this point, we have probably seen the majority of the big move up. Even though the Fed is expected to raise rates in December and possibly three to four times in 2019, there are other forces at work that are anchoring our rates to lower levels.
The first being the lower level of global interest rates. As you will see on the chart below, as of September 30, 2018, the U.S. is issuing 10 year bonds at 3.46%. When you look at other “credit worthy” counties like Germany, they are issuing their 10 year bonds at 0.69%. So when foreign countries have cash to park, they will gladly take the 3.46% interest rate for 10 years as opposed to 0.69% for 10 years. This makes the demand for US debt high around the global and we are not pressured to issue our debt at higher rates to entice buyers because our rates are already a lot higher than debt being issued by other governments around the world.
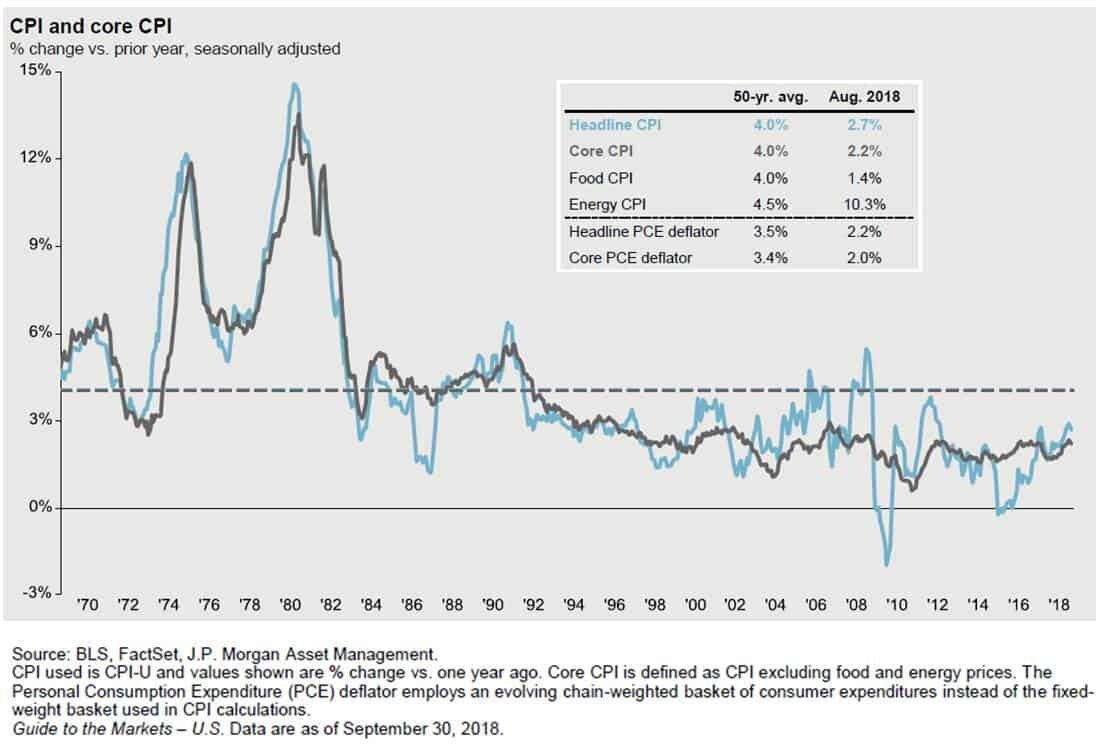
The second reason that rates are most likely to remain at lower levels over the next few months is tame inflation. When inflation rises above the Fed’s 2% target rate, they often respond by raising the Fed Funds Rate either more frequently or by larger increments. As you will see in the chart below, the annual year over year change in the core Consumer Price Index (CPI) as of August 2018, which is the Fed’s primary measure of inflation, was only up 2.2%. Very close to the Fed’s target range so the Fed is not behind the inflation curve. If inflation was roaring ahead at 3% or higher it would probably prompt the Fed to raise the Fed Funds rate faster than the market expects.
Rates Are Still At Healthy Levels
Even though interest rates are rising, they are still at historically low levels. Which then prompts the question: “At what level do interest rates become problematic?” If we use history as a guide, it would seem that once the yield on the U.S. 10 year treasury bond reach 4.50%, returns from the stock market come under pressure in the two year following the breach of that threshold. But historically, when rate are where they are now and moving higher, the stock market has traditionally moved higher as interest rates were rising.
See the chart below which illustrated the correlation between interest rates and stock prices. Each dot on this chart represents a 2 year return from the stock market between 1963 and 2018. If there is a positive correlation, that means interest rates are moving higher and stock prices are moving higher at the same time. This is illustrated with a dot placed above the line in the chart. Those are favorable environments and it makes sense because in the early stages of a rising rate environment the Fed is raising rates because the economy is healthy but rates are not higher enough yet where they are harming the growth rate of the economy.
Visa versa when the dots are below the line that means that there is a negative correlation between interest rates meaning interest rates are going up and stock prices are going down.

If you look at where 3.25% would be on the x axis you will not see any dots below the line. That would imply that between 1963 – 2018 when the interest rate on the 10 year treasury bond were at the current level and moving higher, two years later stock prices were always higher. Otherwise you would see a dot below the line. If the stock market were to be lower 2 years from now and interest rates are at their current rates and moving higher, it would be the first time that has ever happened within the last 55 years.
Could stock prices be lower 2 year from now? Sure they could but if you use history as a guide, it would suggest that such an event would have a low probability of occurrence.
Conclusion
As of right now, it would seem that the recent sell-off in the U.S. stock market was triggered by an unexpected rise in interest rates over the past two week. While higher interest rates are often revered as an unwelcome guest to bull markets, history would suggest that interest rates have not reached levels that would prompt an end to the current economic expansion. We would also add that there are other forces at work such as tame inflation rates and a lower global interest rate environment that may prevent a further dramatic increase in rates from the current levels.
About Michael……...
Hi, I’m Michael Ruger. I’m the managing partner of Greenbush Financial Group and the creator of the nationally recognized Money Smart Board blog . I created the blog because there are a lot of events in life that require important financial decisions. The goal is to help our readers avoid big financial missteps, discover financial solutions that they were not aware of, and to optimize their financial future.

