

Divorce: The Difference Between Mediation, Collaborative, and Litigation
While making the decision to get a divorce can be difficult, it's equally important to decide which path for the divorce process is the right one for you and your current spouse. There are three options:

While making the decision to get a divorce can be difficult, it's equally important to decide which path for the divorce process is the right one for you and your current spouse. There are three options:
Mediation
Collaborative
Litigation
It important to understand the interworking's of each option before making a decision. For example, "trying" mediation in an attempt to save money could land you directly in a litigation battle without the opportunity to give the collaborative process a shot which may have been the right choice in the first place.
Mediation
In working with our clients, we have seen mediation work for some couples and not for others. For couples that can make mediation work, it is usually the preferred method because it provides a couple with the more control over the timeline of the divorce process, more choices, and it’s usually the least costly of the three options.
Litigation is where each side “lawyers up” and you do battle in court. We have seen litigations that go on for years costing tens of thousands of dollars in legal fees on both sides. What many people don’t realize is only about 5% of all divorce cases end in a judge’s ruling. Instead, approximately 95% of the divorce cases end in a settlement between the two soon to be ex-spouses. So the obvious question is “why should a couple use their martial assets to pay large attorney fees if they can just reach an agreement themselves?”
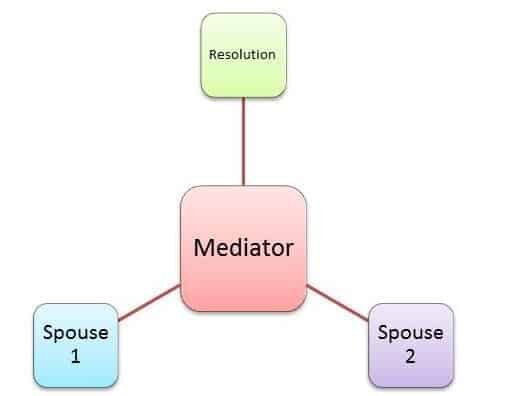
In conjunction with the mediation process, a couple meets with a mediator with the goal of working out their own agreement with regard to distribution of property / assets / liabilities, retirement assets, taxes, child custody, child support, and spousal maintenance. The mediator serves as a non-bias guide as you work towards an agreement.
You can ask questions like:
“How is child support calculated?”
“What items do we need to consider for the child custody agreement?”
“How do we assign a value to our business?”
“What is the tax impact of splitting the retirement accounts?”
Overcoming Tough Issues
You may find that you are able to reach an amicable agreement on a majority of the items that will be included in your agreement but what happens in the mediation process for the handful of items that you do not agree upon? It's the job of the mediator to help you to work through those tough issues. It may involve the mediator suggesting possible solutions or asking additional questions to obtain more information about the issue. By keeping the lines of communication open and asking additional questions, it can lead to elegant solutions that were not initially identified as an option.
Ground Rules
While it's important to keep the lines of communication open during the mediation process it may be a wise to agree on a set of ground rules for the mediation process. One of those rules may be that you cannot talk about the divorce outside of the formal mediation sessions. Sometime this is where mediation falls apart. Everything seems to be going great but you are working on one or two of those tough issues that's preventing the final settlement agreement, you go home, get into a heated argument without the presence of the mediator to help reign the emotions back in, and the next thing you know the mediation process is dead because the spouses are no longer speaking to each other. Ground rules are an important part of the process.
Control Over The Timeline
One of the big advantages of the mediation process is it gives you a high degree of control over how long the divorce process takes from start to finish. You do not have to wait for replies from the other side's attorney or court dates. The mediation process moves as fast or as slow as you would like it too. The mediation process is often completed in 3 to 10 meetings. According to www.mediate.com the average mediation case settles in 90 days.
Making The Mediation Process Work
Having seen clients go through this process, there are a few key items that need to exist for the mediation process to really work.
The couple must be able to communicate effectively
Both spouses need to feel like they can represent their own interests
Both spouses need to feel comfortable making financial decisions
There is general sense of trust and a willingness to compromise
Communication
If for whatever reason you can't stand the sight of your soon to be ex-spouse, most likely mediation is not going to work. Both spouses need to be able to openly communicate with each other to reach an agreement.
Represent Personal Interests
If one of the spouses feels like that they cannot adequately represent their interests or feel intimidated about speaking openly about what's important to them, the mediation process is probably not the right option. There are a lot of very important decisions being made in a relatively short period of time. It's important for each spouse to be confident that they fully understand the terminology being discussed, the decisions that are being made, and the long term impact of those decisions once the divorce is finalized.
The Non-Financial Spouse
Since one of the important items included in the divorce agreement is the separation of marital assets, if you or your spouse is intimidated by financial terms or finances in general, it can jeopardize the mediation process. However, if this is the case, it's important for the non-financial spouse to establish a trusted relationship with a financial planner that will help them to understand the short and long term impact of the financial decisions that they are making in conjunction with the mediation process. Items like establishing a budget, determining whether or not they can afford to stay in the marital house, retirement projection, paying down debt, the tax impact of child support, alimony payment, and other material items that will impact their overall financial plan post divorce. For the non-financial spouse, if this relationship is not established during the mediation process, it can lead to the downfall in the mediation process because the non-financial spouse may feel like they don't even know the right financial questions to be asking during the mediation process.
Trust & Compromise
Negotiating in good faith and a willingness to compromise are key to making the mediation process work. As soon as one spouse thinks the other spouse is hiding something, it’s game over for the mediation process. It triggers that natural response, if he or she is hiding one thing, what else are they hiding?
Reaching an agreement requires comprise especially on the difficult issues. If either spouse going into the mediation process is unwilling to give up any ground, it will make the mediation process difficult if not impossible. Married couples pursing a divorce have to remember that same amount of income and assets that were previously supporting a single household are now being used to support two separate households. It typically costs more to support two households instead of one. Two mortgages, two sets of clothes for the kids, two cable bills, etc. Both sides typically have to adjust their standard of living after the divorce is finalized.
Collaborative Divorce
If mediation is not a good fit for you, instead of just defaulting to the litigation option, an option that is growing rapidly in popularity is Collaborative Divorce.
Unlike mediation where it’s just you, your spouse, and a mediator, in the collaborative setting each spouse retains their own attorney to represent them at the table.

The goal of the attorneys in the collaborative setting is the same as the mediator, to reach an amicable agreement between you and your spouse. In fact, the attorneys will typically sign an agreement that if the collaborative process fails and you are unable to reach an agreement, those same attorneys are excluded from representing you in a litigation case. In other words, no matter how much you like your attorney, you would have to find a different attorney if you end up in court. This is an important aspect of the collaborative process because everyone is driving toward a settlement agreement. In divorce cases, people worry that their spouse’s attorney will try to “stir the pot” and get their spouse worked up about certain issues. If the collaborate process fails, both attorneys are out of the picture.
More Support
Having your own attorney sitting next to you and negotiating on your behalf is what many people need to feel comfortable that nothing is being missed and the right decisions are being made on their behalf. If negotiations get too intense during a collaborative session you can take a break, regroup, and seek counsel from your attorney.
Who Is Involved?
In most collaborative divorce cases there are anywhere from 4 to 7 people sitting at the table:
You
Your Attorney
Your Spouse
Your Spouse's Attorney
A Coach or Mediator
Child Specialist
Financial Specialist
The coach or mediators serves as a neutral. They coordinate the meetings, ask questions to help facilitate the negotiations, and help set and enforce the ground rules for the collaborative process. A child specialist can be involved in specific meetings to coordinate the child custody agreement or a financial specialist can be called in to assist in equitable distribution of the martial assets.
What Does It Cost?
Collaborate Divorce is not cheap. You have attorneys involved, a coach, and possibly specialists to help reach an agreement. However, the collaborative process provides you with more control compared to litigation. It provides you with more control over the duration of the divorce process and control over the terms of your agreement. Similar to mediation, the pace of the collaborative process is set by the parties involved. You do not have to wait for court dates. We have seen some collaborative cases reach an agreement faster than a mediation case because the attorneys were there to help push the process along.
It also provides you with more control over the terms of your agreement because you are not tied to “what the law says”. You can create solutions that work for you, work for your spouse, but are outside the boundaries of case law. Also you are not tied to decisions that are handed down by a judge that does not know you or your kids.
In many cases, collaborative ends up being less expensive than full litigation because the duration of the divorce process tends to be shorter since everyone is driving toward a settlement. But given the number of professionals involved in the process, it’s typically more expensive than mediation.
Litigation
Litigation is what most of us think of when we hear the word “divorce”. You go out and find the best attorney that is going to make your soon to be ex-spouse pay!!! Sometimes litigation is unavoidable. As mentioned earlier, if you can’t stand the sight of your ex-spouse sitting across the table from you, then most likely mediation and collaborative are not going to work.
Litigation is usually the most expensive route to go. Attorneys bill by the hour and when you have court dates, your attorney will usually begin their bill rates as soon as they leave the office. Also they have to spend time replying to motions from your spouse’s attorney, preparing for court, and calling experts to testify in court. All too often, an attorney can look at the assets and income of a couple that is getting divorced and they can ballpark the amount of the child support, alimony, and an approximate asset split based on past settlement agreement. The couple then proceeds to spend months and sometimes years in court arguing about this, that, and other thing just to end up in the same spot but with less assets because both sides had to pay their attorneys $20,000+ in legal fees. It’s for this reason that the collaborative divorce process is gaining traction.

About Michael.........
Hi, I’m Michael Ruger. I’m the managing partner of Greenbush Financial Group and the creator of the nationally recognized Money Smart Board blog . I created the blog because there are a lot of events in life that require important financial decisions. The goal is to help our readers avoid big financial missteps, discover financial solutions that they were not aware of, and to optimize their financial future.


What Happened The Last Time The Dow Dropped By More Than 4% In A Day?
Yesterday was an “ouch”. The Dow Jones Industrial average dropped by more than 1000 points resulting in a 4.60% drop in the value of the index. While yesterday marked the largest “point” decline in the history of the Dow Jones Index, it was not anywhere near the largest percentage decline which is the metric that we care about.

Yesterday was an “ouch”. The Dow Jones Industrial average dropped by more than 1000 points resulting in a 4.60% drop in the value of the index. While yesterday marked the largest “point” decline in the history of the Dow Jones Index, it was not anywhere near the largest percentage decline which is the metric that we care about.
Below is a chart that shows the largest daily “point” losses in the history of the Dow Jones Industrial Index:
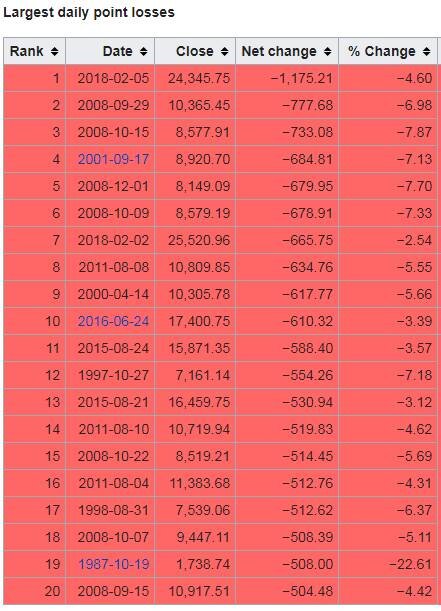
You will find yesterday at the top of the chart. Now look at the column all the way to the right labelled “% change”. You will notice that while yesterday topped the chart from a point decline, it does not come anywhere near the largest percentage decline that we have seen. In fact, it does not even make it in the top 20 worse days for the Dow. See the chart below that shows the largest daily percentage declines in the Dow’s history:

What Happened Last Time?
Whenever there is a big drop in the stock market, I immediately start looking back in history to find market events that are similar to the current one. So when was the last time the market dropped by more than 4% in a single day?
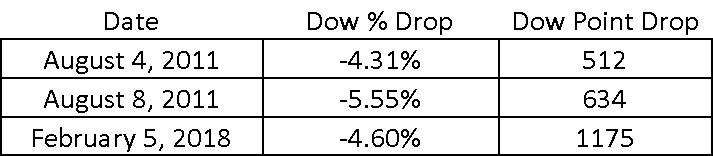
The answer: August 8, 2011
If you remember, 2011 was the start of the European Sovereign Debt Crisis. That was when Greece, Portugal, Spain, and Ireland announced that they were unable to repay their government debt and needed a bailout package from the European Union to survive. There were two single day declines in the month of August that rivaled what we saw yesterday.
How Long Did It Take The Market To Come Back?
If we are looking to history as a guide, how long did it take for the market to recoup the losses after these large single day declines? On July 31, 2011 the Dow Jones Industrial closed at 11,444, the Europe debt crisis hit, and the market experienced those two 4%+ decline days on August 4th and August 8th. By September 11, 2011, the Dow Jones closed at 11,509, recouping all of its losses from the beginning of August. Thus making the answer to the question: 38 days. The market took 38 days to recoup all of the losses from not one but two 4%+ decline days in 2011.
We Don’t Have A Crisis
The main difference between 2011 and now is we don’t have a global economic crisis. In my opinion, the market correction in 2011 was warranted. There was a real problem in Europe. We were not sure how and if those struggling Eurozone countries could be saved so the market dropped.
The only trigger that I hear analysts pointing to in an effort to explain the selloff yesterday is the 2.9% wage growth number that we got on Friday. This in turn has sparked inflation fears and in reaction, the Fed may decide to hike rates four times this year instead of three. Hardly a “crisis”. Outside of that nothing else meaningful has happened to trigger the volatility that we are seeing in the stock market. OK……so what should you do in reaction to this? Sometimes the right answer is “nothing”. It’s difficult to hear that because emotionally you want to pull money out of the market and run to cash or bonds but absent a sound economic reason for making that move, at this point, the best investment decision may be to just stay the course.
We Have Forgotten What Volatility Feels Like
When you are in a market environment like 2017, you very quickly forget what normal market volatility feels like. In 2017, the stock market just gradually climbed throughout the year without any hiccups. That’s not normal. Below is a chart that shows the magnitude of market corrections each year going back to 1990. As you will see, on average, when the economy is not in a recession, the market averages an 11.56% correction at some point during the year. In 2017, we only experienced a 3% correction.

intra year drops in the S&P 500 Index
Now the next chart shows you the big picture. Not only does it illustrate the amount of the largest market correction during the year but it also shows the return of the S&P 500 for the year.

Look at 2016. In 2016, at some point in the year the S&P 500 Index dropped by 11%. If you just held through it, the S&P 500 returned 10% for the year.
In 2011, the S&P 500 dropped by 19% during the year!! If you didn’t sell and just held through the volatility, you would have had a breakeven year.
Easier Said Than Done
Every big market correction feels like a new world ending crisis. It’s not. We have been fortunate enough to have a nice easy ride for the past 12 months but it seems like we are returning to more historical levels of volatility. Days like February 5, 2018 will test your patience and make you feel compelled to react. It’s easy to look back and confess that “yes, I should have just held through it” but it’s easier said than done.
It’s important to understand the catalysts that are driving the volatility in the markets. Sometimes the markets are dropping for a good reason and other times it’s just plain old fashion volatility. Based on what we have seen over the past few days and absent the emergence of a new economic, political, or global crisis, we expect it to be the later of the two.
About Michael……...
Hi, I’m Michael Ruger. I’m the managing partner of Greenbush Financial Group and the creator of the nationally recognized Money Smart Board blog . I created the blog because there are a lot of events in life that require important financial decisions. The goal is to help our readers avoid big financial missteps, discover financial solutions that they were not aware of, and to optimize their financial future.


When Do Higher Interest Rates Become Harmful To The Stock Market?
On Friday, the jobs report came out and it was a strong report. The consensus was expecting 180,000 new jobs in January and the actual number released on Friday ended up being 200,000. So why did the markets drop? The answer: wage growth. The jobs report not only contains how many new employees were hired but it also includes the amount

On Friday, the jobs report came out and it was a strong report. The consensus was expecting 180,000 new jobs in January and the actual number released on Friday ended up being 200,000. So why did the markets drop? The answer: wage growth. The jobs report not only contains how many new employees were hired but it also includes the amount that wages for the current workforce either increased or decreased on a year over year basis. The report on Friday indicated that wages went up by 2.9% year over year. That is the strongest wage growth number since 2009.
Double Edged Sword
Wage growth is a double edged sword. On the positive side, when wages are going up, people have more money in their paychecks which allows them to spend more and consumer spending makes up 70% of our GDP in the United States. I'm actually surprised the market did not see this coming. The whole premise behind tax reform was "if we give U.S. corporations a tax break, they will use that money to hire more employees and increase wages." The big question people had with the tax reform was "would the trickle down of the dollars saved by the corporations eventually make it to the employees pockets?" Many corporations in January, as a result of tax reform, announced employee bonuses and increases to the minimum wage paid within their organizations. The wage growth number on Friday would seem to imply that this is happening. So again, I'm actually surprised that the market was not ready for this and while the market reacted negatively I see this more as a positive long term trend, instead of a negative one. If instead the U.S. corporations decided not to give the bonuses or increase wages for employees and just use the money from the tax reform savings to increase dividends or share buybacks, then you probably would have seen only a moderate increase in the wage growth number. But that also would imply that there would be no "trickle down" effect to the middle class.
The Downside
This all sounds really positive but what is the downside to wage growth? While wage growth is good for employees, it's bad for corporate earnings. If I was paying Employee A $50,000 in 2017 but now I'm paying them $55,000 per year in 2018, assuming the output of that employee did not change, the expenses to the company just went up by $5,000 per year. Now multiply that over thousands of employees. It's a simple fact that higher expenses without higher output equals lower profits.
Wage Growth = Inflation
There is another downside to wage growth. Wage growth is the single largest contributor to inflation. Inflation is what we use to measure the increase in the price of goods and services in the U.S.. Why are these two measurements so closely related? If your salary just increased by $300 per month, when you go to the grocery store to buy milk, you may not notice that the price of milk went up by $0.15 over last week because you are making more in your paycheck. That is inflation. The price of everything starts going up because, in general, consumers have more take home pay and it gives the sellers of goods and services more pricing power. Visa versa, when the economy is in a recession, people are losing their jobs, and wages are decreasing. If you sell cars and you decided to raise the price of the cars that you sell, that may cause the consumer to not buy from you and look for a lower priced alternative. Companies have less pricing power when the economy is contracting and you typically have "deflation" not inflation.
When Does Inflation Become Harmful?
Some inflation is good. It means the economy is doing well. A rapid increase in inflation is bad because it forces the Fed to use monetary policy to slow down the economy so it does not over heat. The Fed uses the Federal Funds Rate as their primary tool to keep inflation in check. When inflation starts heating up, the Fed will often raise the Fed Funds Rate to increase the cost of lending which in turn reduces the demand for lending. It’s like tapping the brakes in your car to make sure you do not accelerate too quickly and then go flying off the road.
If some inflation is good but too much inflation is bad, the question is at what point do higher interest rates really jeopardize economic growth? The chart below provides us with guidance as to what has happened in the past when interest rates were on the rise.
correlation between interest rates and stocks
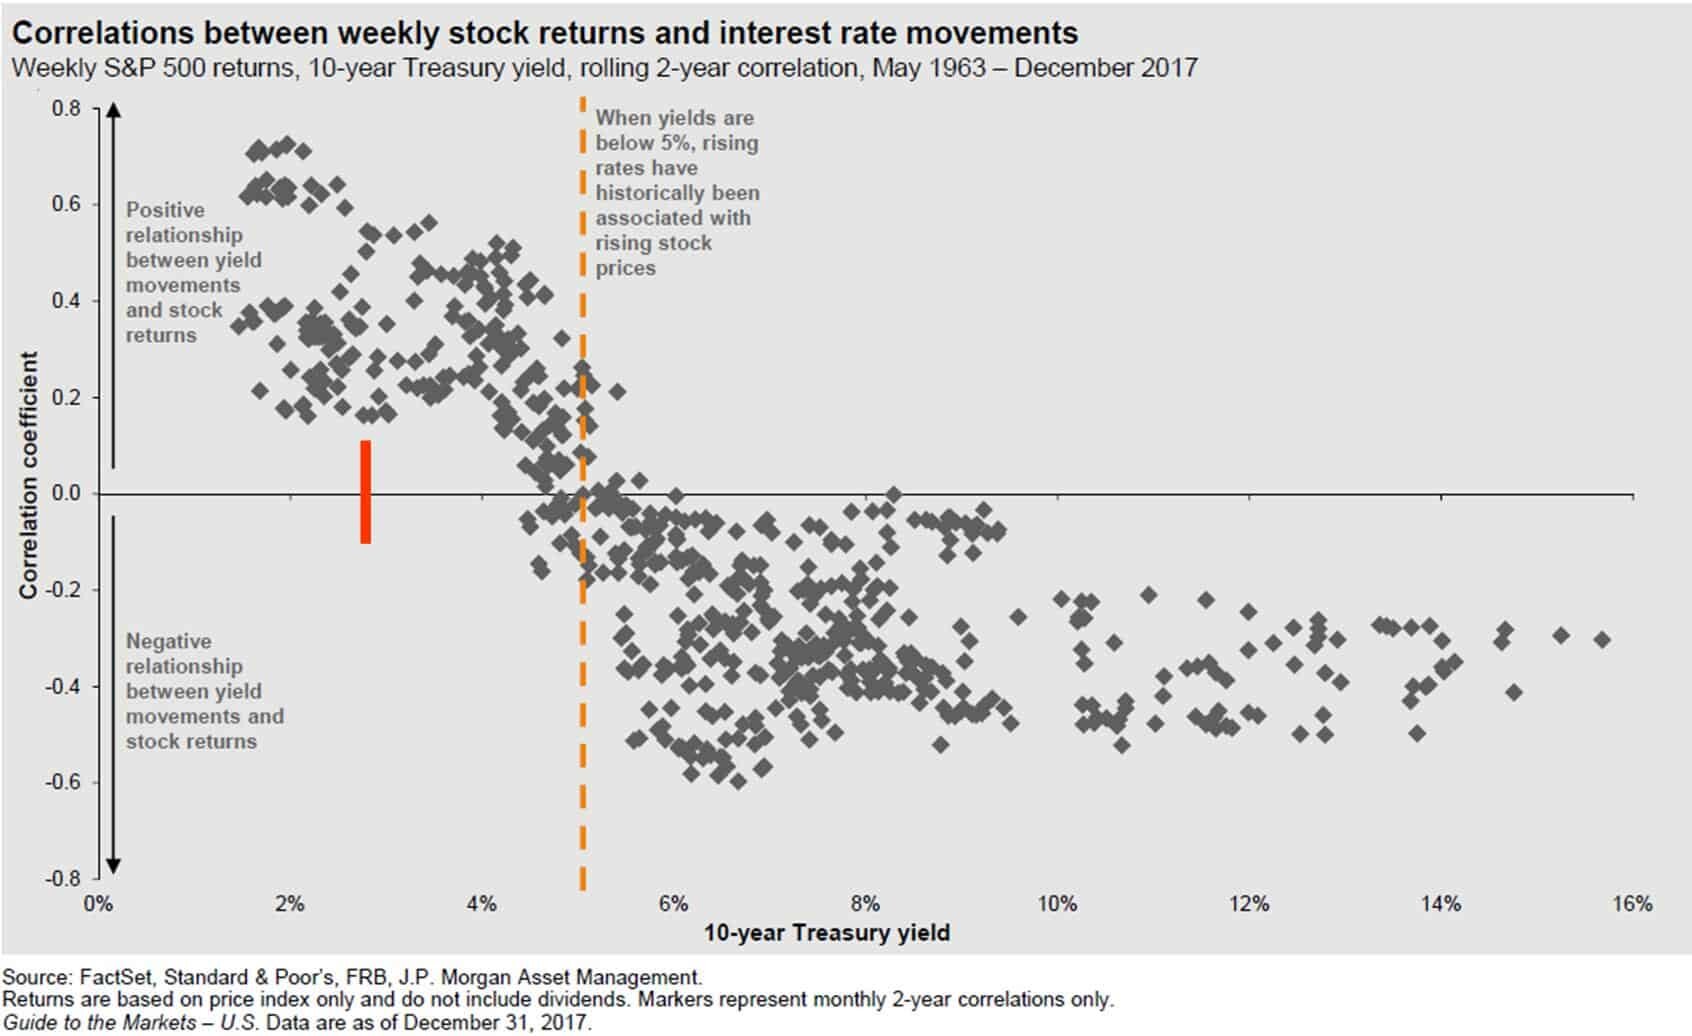
The chart compares every 2 year period in the stock market versus the level of the 10-Year Treasury yield between 1963 – 2017. For example, one dot would represent the time period 1963 – 1964. Another dot would represent 1964 – 1965 and so on. If the dot is above the “0.0” line, that means that there was a “positive correlation” between stock prices going up and the interest rate on the 10-Year Treasury yield going up during that same time period. Worded another way, when the dot is above the line that means the stock market was going up while interest rates were also increasing. In general, the dots above the line are good, when they are below the line, that’s bad.
Right now the 10-Year Treasury Bond is at 2.85% which is the red line on the chart. What we can conclude from this is going all the way back to 1963, at this data point, there has never been a two year period where interest rates were rising and stock prices were falling. Could it be different this time? It could, but it’s a low probability if we use historical data as our guide. History would suggest that we do not run into trouble until the yield on the 10-Year Treasury Bond gets above 4%. Once the yield on our 10-Year Treasury Bond reaches that level and interest rates are rising, historically the correlation between rising interest rates and stock prices turns negative. Meaning interest rates are going up but stock prices are going down.
It makes sense. Even though interest rates are moving up right now, they are still at historically low levels. So lending is still “cheap” by historical standards which will continue to fuel growth in the economy.
A Gradual Rise In Interest Rates
Most fixed income managers that we speak with are expecting a gradual rise in interest rates throughout 2018. While we expect interest rates to move higher throughout the year due to an increase in wage growth as a result of a tighter labor market, in our opinion, it’s a stretch to make the case that the yield on the 10-year Treasury will be at 4% by the end of the year.
If the U.S. was the only country in the world, I would feel differently. Our economy is continuing to grow, wages are increasing, the labor markets are tight which requires companies to pay more for good employees, and all of these factors would warrant a dramatic increase in the rate of inflation. But we are not the only country in the world and the interest rate environment in the U.S. is impacted by global rates.
The chart below illustrates the yield on a 10 year government bonds for the U.S., Japan, Germany, UK, Italy, Spain, and total “Global Ex-U.S.”.
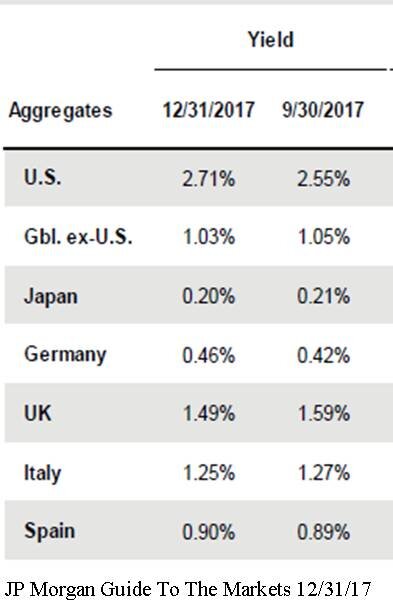
global interest rates
On December 31, 2017 the yield on a 10-Year Government Bond in the U.S. was 2.71%. The yield on a 10-Year government bond in Germany was only 0.46%. So, if you bought a 10-Year Government Bond from Germany, they are going to hand you back a measly 0.46% in interest each year for the next 10 years.
Why is this important? The argument can be made that while the changes in the Fed Funds Rate may have a meaningful impact on short-term rates, it may have less of an impact on intermediate to longer term interest rates. When the U.S. government needs more money to spend they conduct “treasury auctions”. The government announces that on a specified date that they are going to be selling “30 million worth of 10-year treasury bonds at a 2.8% rate”. As long as there is enough demand to sell all of the bonds at the 2.8% rate, the auction is a success. If there is not enough demand, then they may have to increase the interest rate from 2.8% to 3% to sell all $30 million worth of the bonds. While the U.S. 10-Year Treasury Bond only had a yield of 2.71%, it’s a lot higher than the other trusted government lenders around the world. As you can see in the chart above, the average 10-year government bond yield excluding the U.S. is 1.03%. This keeps the demand for U.S. debt high without the need to dramatically increase the interest rate on new government debt issuance to attract buyers of the debt.
As for the trend in global interest rates, you will see in the chart that from September 30, 2017 to December 31, 2017, global 10-year government bond yields ex-U.S. decreased from 1.05% to 1.03%. While we are in the monetary tightening cycle in the U.S., there is still monetary easing happening around the world as a whole which should prevent our 10-year treasury yields from spiking over the next 12 months.
Impact on Investment Portfolios
The media will continue to pounce on this story about “the risk of rising interest rates and inflation” throughout 2018 but it’s important to keep it in context. If tax reform works the way that it’s supposed to, wage growth should continue but we may not see the positive impact of increased consumer spending due to the wage growth until corporate earnings are released for the first and second quarter of 2018. We just have to wait to see how the strength of consumer spending nets out against the pressure on corporate earnings from higher wages.
However, investors should be looking at the fixed income portion of their portfolio to make sure there is the right mix of bonds if inflation is expected to rise throughout the year. Bond duration and credit quality will play an important role in your fixed income portfolio in 2018.
About Michael.........
Hi, I’m Michael Ruger. I’m the managing partner of Greenbush Financial Group and the creator of the nationally recognized Money Smart Board blog . I created the blog because there are a lot of events in life that require important financial decisions. The goal is to help our readers avoid big financial missteps, discover financial solutions that they were not aware of, and to optimize their financial future.

The Dow Dropped 362 Points Yesterday. Now What?
When you hear that the Dow Jones Industrial Average dropped by over 300 points it gets your attention. It triggers that automatic emotional response which leads you to ask, "Is the market rally ending?" I'm going to start this article by saying "I'm not a cheerleader for the stock market". As a cheerleader, it's your job to cheer whether your team is

When you hear that the Dow Jones Industrial Average dropped by over 300 points it gets your attention. It triggers that automatic emotional response which leads you to ask, "Is the market rally ending?" I'm going to start this article by saying "I'm not a cheerleader for the stock market". As a cheerleader, it's your job to cheer whether your team is winning or losing. Sometimes the general public views investment advisors that way. "Of course my advisor has a rosy outlook. He wants me to stay invested".
My view is when the cycle is ending it's ending. When the data tells us that we are headed toward the next recession, you just have to accept a lower expected rate of return and make the necessary allocation changes to preserve principal during the market downturn. The answer is not always "just hold through it" which is unfortunately the answer that some investors receive from their advisor regardless of what's happening in the markets and the economy.
What Has Changed?
Whenever you have a big down day in the market the first question you should ask yourself is "What changed?" I know the value of the stock market changed but the question I'm really asking is what fundamental change happened in the U.S. economy to trigger the selloff?
Did GDP growth rate pull back unexpectedly?
Did the monthly jobs report come up short? Did inflation increase by a large number that wasn't expected?
Are corporate earnings deteriorating?
Has the leading indicators index turned negative?
These are the real questions that you should be asking. Remember, the economy leads the stock market. The stock market does not lead the economy. Watching the fluctuations in the stock market and using that as a tool to make investment decisions is a recipe for disaster. You are much more likely to find success in your investments if you use a trading app uk that is able to help you track prices and automate your trading.
A growing economy typically means higher corporate earnings
Higher corporate earnings often results in higher stock prices
With that said, sometimes the market is down because it's reacting to poor economic data. In those cases, the market downturn may be warranted. However, that is not what I think happened yesterday. We did not get a bad jobs number or shortfall in GDP growth. In short, as of yesterday, nothing has changed from an economic standpoint. Days like yesterday are just a reminder of what volatility in the markets feels like.
Higher Volatility Ahead
If you asked me if I expect more or less days like yesterday in 2018, my guess would be more. We are all suffering from "recency bias". 2017 was this nice smooth ride higher with very few interruptions. When you get used to sailing in smooth waters, a small wave can seem like a tsunami. Below is a chart of the CBEO Vix Index from January 2002 – January 2018 which is used to gauge the level of volatility in the U.S. stock market:
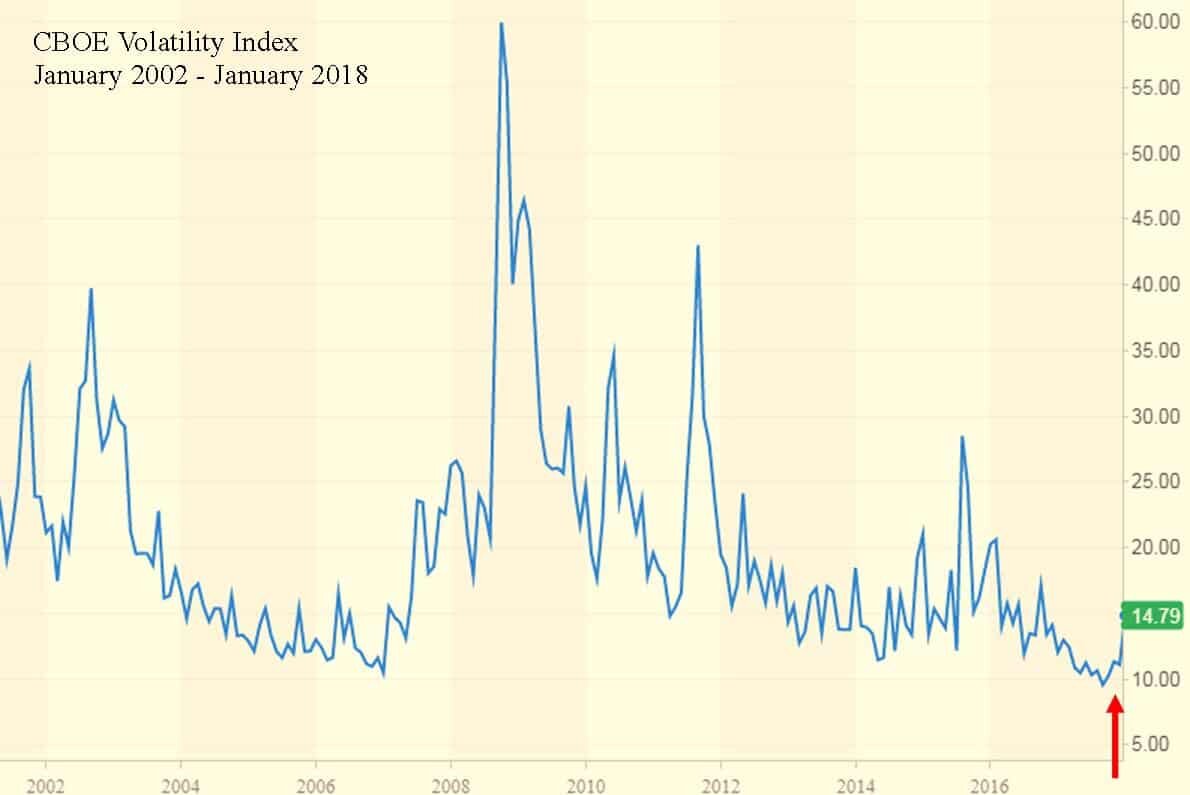
As you can see, we are coming off of historically low levels of volatility and we have to remember that volatility is normal. Every down tick in the stock market is not necessarily a signal that a recession is coming.
The Math Is Different
What if I told you that the market was only down 177 points yesterday? It probably does not trigger the same fear reaction as being down over 350 points. The reason why I ask this question is you have to remember that the price level of the Dow has doubled over the last 6 years. So a 300 point drop in the Dow Jones Industrial Average today does not mean the same thing as a 300 point drop in 2012. On February 17, 2012, the Dow Jones Industrial Average closed at 12,949. Today it sits just above 26,000. In percentage terms, a 300 drop in 2012 equaled a 2.3% drop in the stock market. If you translate that to where the stock market is today, you would need a 598 point drop in a single day to get that same 2.3% drop. It's just math but we have to remember this when the headlines in the media read:
"The Dow Dropped By 300 Points Today. Traders Are Worried That This Could Be The End Of The Rally?"
Never Hesitate
While I write these articles to help our clients and readers to become better investors and to put important market events into perspective, I have a special note that I want to leave off on for our clients. When you have that feeling of uncertainty, never hesitate to contact me. That quick phone call just to ask, "Mike, should I be worried?" That's what I'm here for. Have a great week everyone!!
About Michael.........
Hi, I’m Michael Ruger. I’m the managing partner of Greenbush Financial Group and the creator of the nationally recognized Money Smart Board blog . I created the blog because there are a lot of events in life that require important financial decisions. The goal is to help our readers avoid big financial missteps, discover financial solutions that they were not aware of, and to optimize their financial future.


The Marriage Penalty: Past and Present
Whether you're currently married or not, the new tax legislation may impact how the "Marriage Penalty" affects you. Never heard of such a thing? Let's take a look at a simple example and show how it may be different under the new tax regulation.

The Marriage Penalty: Past and Present
Whether you're currently married or not, the new tax legislation may impact how the "Marriage Penalty" affects you. Never heard of such a thing? Let's take a look at a simple example and show how it may be different under the new tax regulation.
The Past (kind of)
I say "kind of" because most people still have to file their 2017 tax return. Here is the 2017 tax table for Single Filers and Married Filing Joint Filers:
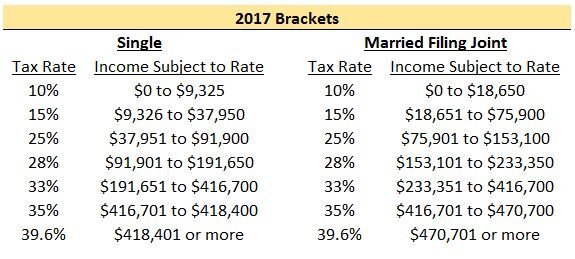
A reasonable person would think that the income subject to tax would simply double if you went from filing Single to Married Filing Joint. As you can see, this isn't the case once you are in the 25%+ tax bracket and it can mean big dollars! Let's take a look at a simple example where each person makes the same amount of money. We will also assume they will be taking the standard deduction in 2017.
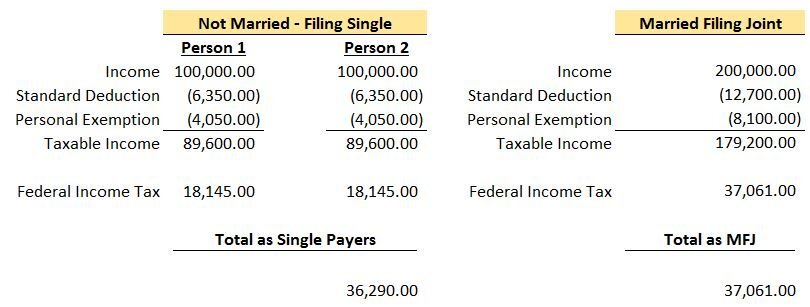
Note: To calculate the “Federal Income Tax” amount above, you can use the IRS tables here 2017 1040 Tax Table Instructions. All of your income is not taxed at your top rate. For example, if your top income falls in the 25% tax bracket, as a single payer you will only pay 25% on income from $37,951 to $91,900. Everything below that range will be taxed at either 10% or 15%.
As you can see, because of the change in filing status, this couple owed a total of $771 more to the federal government. This is the “Marriage Penalty”. Typically as incomes rise, the dollar amount of the penalty becomes larger. For this couple, their top tax bracket went from 25% each when filing single to 28% filing joint.
The Present
Here is the 2018 tax table in the new tax legislation for Single Filers and Married Filing Joint Filers:
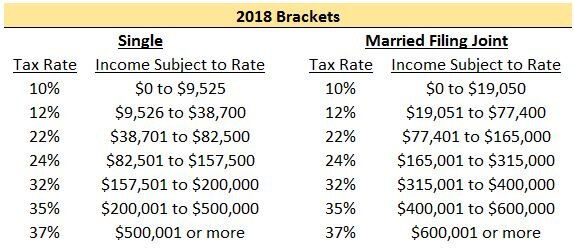
Upon review, you can see that the top income brackets are not doubled for Married Filing Joint. At 37%, a single person filing would reach the top rate at $500,001 while married filing joint would reach at $600,001. That being said, the “Marriage Penalty” appears to kick in at higher income levels compared to the past and therefore should impact less people. The income bracket for Married Filing Joint is doubled up until $400,000 of combined income compared to just $75,901 under the 2017 brackets.
Let’s take a look at the same couple in the example above.
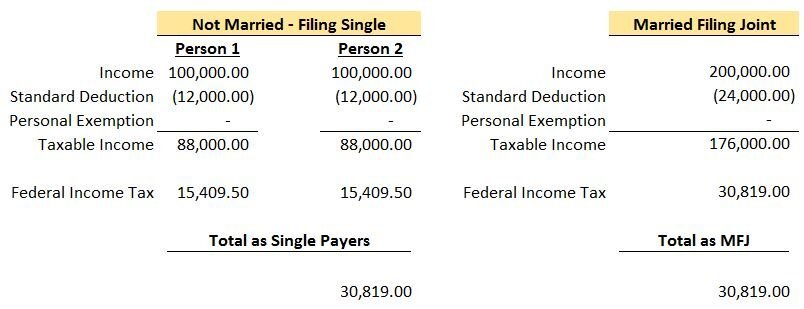
Due to the income brackets doubling from single to married filing joint for this couple, the “Marriage Penalty” they would have incurred in 2017 appears to go away. In this example, they would also pay less in federal taxes in both situations. This article is more focused on the impact on the “Marriage Penalty” but having a lower tax bill is always a plus.
Standard vs. Itemized Deductions
The tax brackets aren’t the only penalty. Another common tax increase people see when going from single to married filing joint are the deductions they lose. If I’m single and own a home, it is likely I will itemized because the sum of my property taxes, mortgage interest, and state income taxes exceed the standard deduction amount. Assume the couple in the example above is still not married but Person 1 owns a home and rather than taking the standard deduction, Person 1 itemizes for an amount of $15,000. For 2017, their total deductions will be $21,350 ($15,000 Person 1 plus $6,350 Person 2) and for 2018, their total deductions will be $27,000 ($15,000 Person 1 plus $12,000 Person 2).
Now they get married and have to choose whether to itemize or take the standard deduction.
2017: Assuming they live together in the same house, in 2017 they would still itemize because they have deductions of $15,000 for Person 1 and some additional items that Person 2 would bring to the table (i.e. their state income taxes). Say their total itemized deductions are $18,000 when married filing joint. They would still itemize because $18,000 is more than the Married Filing Joint standard deduction of $12,700. But now compare the $18,000 to the $21,350 they got filing single. They lose out on $3,350 of deductions. Usually, less deductions equals more taxes.
2018: Assuming they live together in the same house, in 2018 they would no longer itemize. Assuming their total itemized deductions are still $18,000, that is less than the $24,000 standard deduction they can take when married filing joint. $24,000 standard deduction in 2018 is still less than the $27,000 they got filing separately by $3,000. Again, less deductions usually means more taxes. The “Marriage Penalty” lives on!
A lot of people will still lose out on deductions in 2018 but the “Marriage Penalty” will hit less people because of the increase in the standard deduction. If Person 1 has itemized deductions of $10,000 in 2017, they would itemize if they filed single and possibly take the standard deduction of $12,700 filing joint. In 2018 however, Person 1 would take the standard deduction both as a single tax payer ($12,000) and married filing joint ($24,000) which takes away the “Marriage Penalty” related to the deduction.
The Why?
Why do tax brackets work this way? Like most taxes, I assume the idea was to generate more income for the government. Some may also argue that typical couples don't make the same salaries which seems like an archaic point of view.Was it all fixed with the new tax legislation? It doesn't appear so but it does look like less people will be struck by Cupid's Marriage Penalty.
About Rob.........
Hi, I’m Rob Mangold. I’m the Chief Operating Officer at Greenbush Financial Group and a contributor to the Money Smart Board blog. We created the blog to provide strategies that will help our readers personally , professionally, and financially. Our blog is meant to be a resource. If there are questions that you need answered, pleas feel free to join in on the discussion or contact me directly.


The Government Is Shut Down. Should You Be Worried?
The senate was not able to pass a temporary spending bill in the late hours of the night so as of Saturday, January 20th the government is officially shut down. But what does that mean? How will it impact you? What will be the impact on the stock market?

The senate was not able to pass a temporary spending bill in the late hours of the night so as of Saturday, January 20th the government is officially shut down. But what does that mean? How will it impact you? What will be the impact on the stock market?
Don’t Let The Media Scare You
The media loves big disruptive events. Why? The news is a "for profit" business. The more viewers they have, the more profits they make. What makes you watch more news? Fear. If the weather forecasts is 80 degrees and sunny, you just go on with your day. Instead, if the weather is predicting “The Largest Winter Blizzard Of The Century”, my guess is you will be glued to the weather channel most of the day trying to figure out when the storm will hit, how many feet of snow is expected to fall, and are schools closing, etc.
You will undoubtedly wake up this morning to headlines about “The Government Shutdown” and all of the horrible things that could happen as a result. In the short term a government shutdown or a “funding gap” is not incredibly disruptive. Many government agencies have residual funding to keep operations going for a period of time. Only portions of the government really “shut down”. The “essential” government services continue to function such as national security and law enforcement. The risk lies in the duration of the government shutdown. If Congress does not pass either a temporary extension or reach a final agreement within a reasonable period of time, some of these government agencies will run out of residual funding and will be forced to halt operations.
The news will target the “what if’s” of the current government shutdown. What if the government stays shut down and social security checks stop? What if the U.S. cannot fund defense spending and we are left defenseless? All of these scenarios would require a very prolonged government shutdown which is unlikely to happen.
How Often Does This Happen?
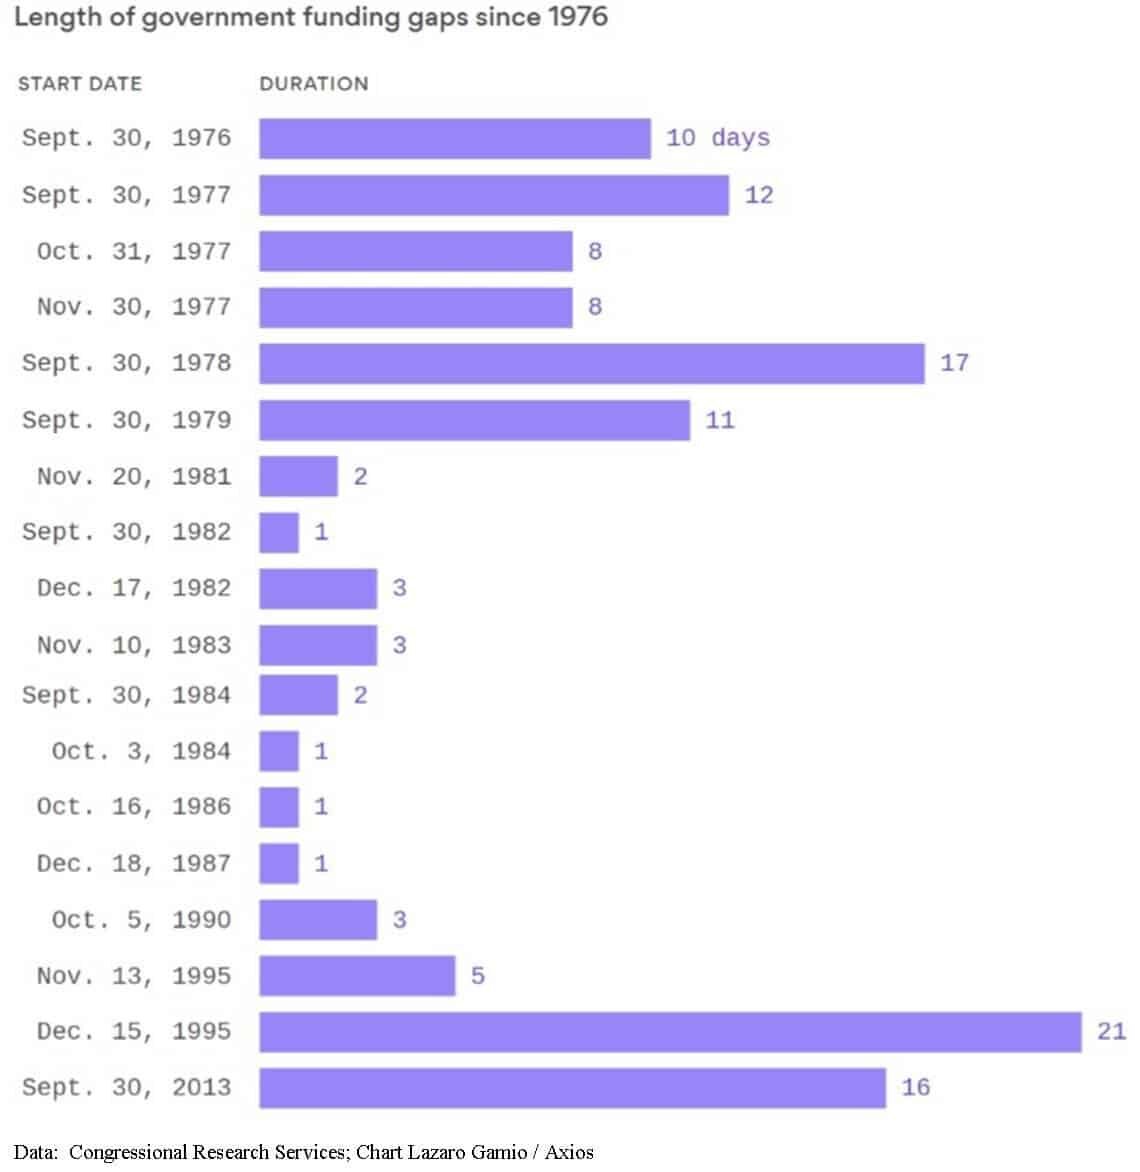
number of days the government is shut down
When I woke up this morning, my first questions was “how often do government shutdowns happen?” Is this an anomaly that I should be worried about or is it a frequent occurrence? The last government shutdown took place on September 30, 2013 and the government stayed shut down for 16 days. Prior to the 2013 shutdown, you have to go back to December 15, 1995. The duration of the 1995 shutdown was 21 days. Making the current government shutdown only the third shutdown between December 15, 1995 – January 20, 2018. Not an anomaly but also not a frequent event.
But let’s look further back. How many times did the U.S. government experience a shutdown between 1976 – 2018? In the past 42 years, the U.S. government has experienced a shutdown 18 times. On average the government shutdowns lasted for about 7 days. This makes me less worried about the current government shutdown given the number of shutdowns that we have overcome in the past.
This Shutdown Could Be Longer
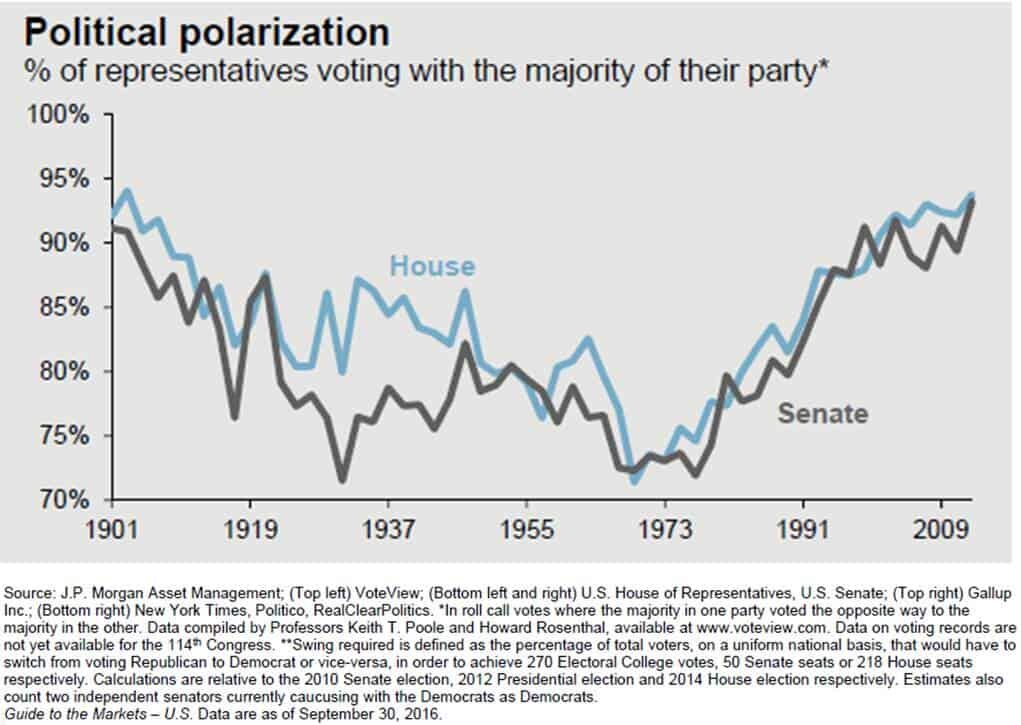
political polarization history
The only thing that worries me a little is the potential duration of the current government shutdown. I would not consider two data points to be a new “trend” but it is hard to ignore that the last two government shutdowns that occurred in 1995 and 2013 were much longer than the 7 day historical average. However, this could be the start of a new trend given how polarized Congress has become. It’s a clear trend that over the past 40 years fewer members of the Senate and House are willing to cross party lines during a vote. See the chart below: Back in 1973, only 73% of the members of Congress voted with the majority of their political party. It would seem rational to assume that during that time period members of Congress were more willing to step across the aisle for the greater good of the American people. Now, approximately 95% of the members of both the House and Senate vote with their own camp. This creates deadlock situations that take longer to resolve as the “blame game” takes center stage.
Impact On The Stock Market
In most cases, injecting uncertainty in our economy is never good for the stock market. However, given the fact that U.S. corporations are still riding the high of tax reform, if the government shutdown is resolved within the next two weeks it may have little or no impact on the markets.
If it were not for the recent passage of tax reform, my guess is this government shutdown may have been completely avoided. Not choosing a side here but just acknowledging the Democratic Party was delivered a blow with passage of tax reform in December. Since the spending bill requires 60 votes to pass in the Senate, it will require support from the Democrats. This situation provides the Democratic party with a golden opportunity to negotiate terms to help make up for some the lost ground from the passage of the Republican led tax bill. This challenging political environment could lengthen the duration of the government shutdown. However, it’s also important to remember that neither party benefits from a government shutdown, especially in a midterm election year.
Over the next two weeks, I would recommend that investors take all the media hype with a grain of salt. However, if a permanent or temporary spending bill is not passed within the next two weeks, it could result in increased volatility and downward pressure on the stock market as government agencies run out of cash reserves and begin to put workers on furlough. At this point, we are really in a “wait and see” environment.
About Michael……...
Hi, I’m Michael Ruger. I’m the managing partner of Greenbush Financial Group and the creator of the nationally recognized Money Smart Board blog . I created the blog because there are a lot of events in life that require important financial decisions. The goal is to help our readers avoid big financial missteps, discover financial solutions that they were not aware of, and to optimize their financial future.

More Taxpayers Will Qualify For The Child Tax Credit
There is great news for parents in the middle to upper income tax brackets in 2018. The new tax law dramatically increased the income phaseout threshold for claiming the child tax credit. In 2017, parents were eligible for a $1,000 tax credit for each child under the age of 17 as long as their adjusted gross income (“AGI”) was below $75,000 for single

There is great news for parents in the middle to upper income tax brackets in 2018. The new tax law dramatically increased the income phaseout threshold for claiming the child tax credit. In 2017, parents were eligible for a $1,000 tax credit for each child under the age of 17 as long as their adjusted gross income (“AGI”) was below $75,000 for single filers and $110,000 for married couples filing a joint return. If your AGI was above those amounts, the $1,000 credit was reduced by $50 for every $1,000 of income above those thresholds. In other words, the child tax credit completely phased out for a single filer with an AGI greater than $95,000 and for a married couple with an AGI greater than $130,000.
Note: If you are not sure what the amount of your AGI is, it’s the bottom line on the first page of your tax return (Form 1040).
New Phaseout Thresholds In 2018+
Starting in 2018, the new phaseout thresholds for the Child Tax Credit begin at the following AGI levels:
Single Filer: $200,000
Married Filing Joint: $400,000
If your AGI falls below these thresholds, you are eligible for the full Child Tax Credit. For taxpayers with an AGI amount that exceeds these thresholds, the phaseout calculation is the same as 2017. The credit is reduced by $50 for every $1,000 in income over the AGI threshold.
Wait......It Gets Better
Not only will more families qualify for the child tax credit in 2018 but the amount of the credit was doubled. The new tax law increased the credit from $1,000 to $2,000 for each child under the age of 17.
In 2017, a married couple, with three children, with an AGI of $200,000, would have received nothing for the child tax credit. In 2018, that same family will receive a $6,000 tax credit. That’s huge!! Remember, “tax credits” are more valuable than “tax deductions”. Tax credits reduce your tax liability dollar for dollar whereas tax deductions just reduce the amount of your income subject to taxation.
Tax Reform Giveth & Taketh Away
While the change to the tax credit is good news for most families with children, the elimination of personal exemptions starting in 2018 is not.
In 2017, taxpayers were able to take a tax deduction equal to $4,050 for each dependent (including themselves) in addition to the standard deduction. For example, a married couple with 3 children and $200,000 in income, would have been eligible received the following tax deductions:
Standard Deduction: $12,700
Husband: $4,050
Wife: $4,050
Child 1: $4,050
Child 2: $4,050
Child 3: $4,050
Total Deductions $32,950
Child Tax Credit: $0
This may lead you to the following question: “Does the $6,000 child tax credit that this family is now eligible to receive in 2018 make up for the loss of $20,250 ($4,050 x 5) in personal exemptions?”
By itself? No. But you have to also take into consideration that the standard deduction is doubling in 2018. For that same family, in 2018, they will have the following deductions and tax credits:
Standard Deduction: $24,000
Personal Exemptions: $0
Total Deductions: $24,000
Child Tax Credit: $6,000
Even though $24,000 plus $6,000 is not greater than $32,950, remember that credits are worth more than tax deductions. In 2017, a married couple, with $200,000 in income, put the top portion of their income subject to the 28% tax bracket. Thus, $32,950 in tax deductions equaled a $9,226 reduction in their tax bill ($32,950 x 28%).
In 2018, due to the changes in the tax brackets, instead of their top tax bracket being 28%, it’s now 24%. The $24,000 standard deduction reduces their tax bill by $5,760 ($24,000 x 24%) but now they also have a $6,000 tax credit with reduces their remaining tax bill dollar for dollar, resulting in a total tax savings of $11,760. Taxes saved over last year: $2,534. Not a bad deal.
For many families, the new tax brackets combined with the doubling of the standard deduction and the doubling of the child tax credit with higher phaseout thresholds, should offset the loss of the personal exemptions in 2018.
This information is for educational purposes only. Please consult your accountant for personal tax advice.
About Michael……...
Hi, I’m Michael Ruger. I’m the managing partner of Greenbush Financial Group and the creator of the nationally recognized Money Smart Board blog . I created the blog because there are a lot of events in life that require important financial decisions. The goal is to help our readers avoid big financial missteps, discover financial solutions that they were not aware of, and to optimize their financial future.

How Much Will Your Paycheck Increase In 2018?
U.S taxpayers have a big reason to celebrate this week. By the end of February, you should see your paycheck increase. The government released the new payroll withholding tables this week which will lower the amount of taxes withheld from your paycheck and increase your take home pay. Naturally the next question is "How much will my paycheck go

U.S taxpayers have a big reason to celebrate this week. By the end of February, you should see your paycheck increase. The government released the new payroll withholding tables this week which will lower the amount of taxes withheld from your paycheck and increase your take home pay. Naturally the next question is "How much will my paycheck go up?" Out of curiously, I spent my Saturday morning comparing the 2017 tax tables to the new 2018 tax tables to answer that question. Yes, this is what nerds do on their weekends.
The Calculation
Like most financial calculations, it's long and boring. I will provide you with the cliff notes version. The government provides your company with tax withholding tables that they enter into the payroll system. It tells your employer how much to withhold in fed taxes from each pay check. The three main variables in the calculation are:
Payroll frequency (weekly, bi-weekly, etc)
The number of withholding allowances that you claim
The amount of your pay
Single Filers or Head of Household
If you are a single or head of household tax filer, I ran the following calculations based on a bi-weekly payroll schedule and an employee claiming one withholding allowance. The table below illustrates how much your annual take home pay may increase under the new tax withholding tables at various salary levels.
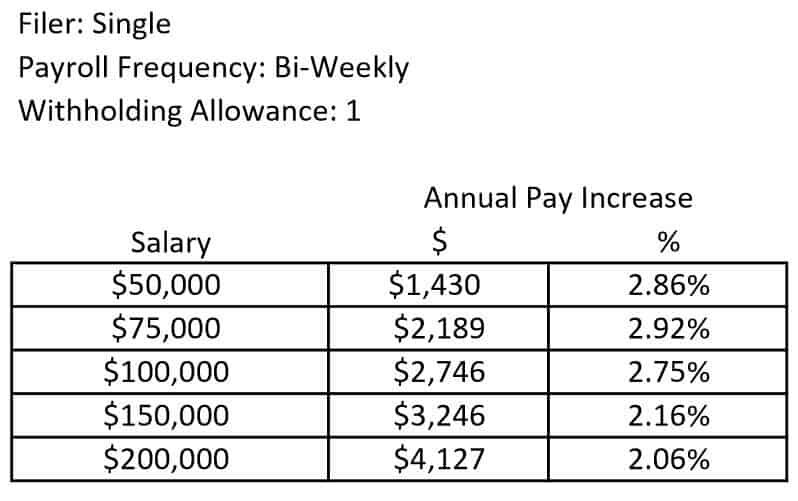
withholding tables - single filer
Based on this analysis, it looks like a single filer’s paycheck will increase between 2% – 3% as soon as the new withholding tables are entered into the payroll system. If you want to know how much your bi-weekly pay will increase, just take the annual numbers listed above and divide them by 26 pay periods. If the payroll frequency at your company is something other than bi-weekly or you claim more than one withholding allowance, your percentage increase in take home pay will deviate from the table listed above.
Married Couples Filing Joint
For employees that are married and file a joint tax return, below is the calculations based on a bi-weekly payroll schedule and two withholding allowances. The table below illustrates how much your annual take home pay may increase under the new tax withholding tables at various salary levels.
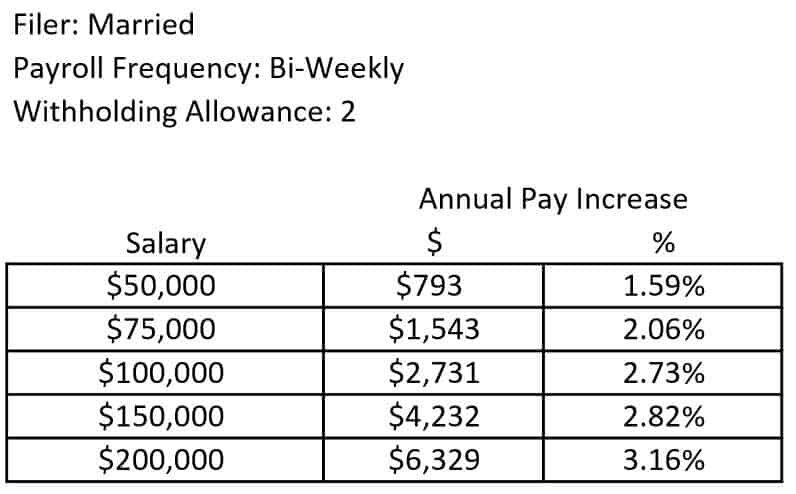
payroll tax withholding table - married
Even though I added an additional withholding allowance in the calculation for the married employee, I was surprised that the “range” of the percentage increase in the take home pay for a married employee was noticeably wider than a single tax filer. As you will see in the table above, the increase in take home pay for an employee in this category range from 1.5% – 3.1%.
Another interesting observation, in the single filer table, the percentage increase in take home pay actually diminished as the employee’s annual compensation increased. In contrast, for the married employee, the percentage increase in annual take home pay gradually increased as the employee’s annual salary increased. Conclusion…..get married in 2018? Nothing says love like new withholding tables.
About Michael.........
Hi, I’m Michael Ruger. I’m the managing partner of Greenbush Financial Group and the creator of the nationally recognized Money Smart Board blog . I created the blog because there are a lot of events in life that require important financial decisions. The goal is to help our readers avoid big financial missteps, discover financial solutions that they were not aware of, and to optimize their financial future.


Business Owners: Strategies To Reduce Your Taxable Income To Qualify For The New 20% Qualified Business Income Deduction
Now that small business owners have the 20% deduction available for their pass-through income in 2018, as a business owner, you will need to begin to position your business to take full advantage of the new tax deduction. However, the Qualified Business Income ("QBI") deduction has taxable income thresholds. Once the owner's personal taxable
Now that small business owners have the 20% deduction available for their pass-through income in 2018, as a business owner, you will need to begin to position your business to take full advantage of the new tax deduction. However, the Qualified Business Income ("QBI") deduction has taxable income thresholds. Once the owner's personal taxable income begins to exceed specific dollar amounts, the 20% deduction with either phase out or it will trigger an alternative calculation that could lower the deduction.
First: Understand The 20% Deduction
If you are not already familiar with how the new 20% deduction works, I encourage you to read our article:"How Pass-Through Income Will Be Taxes In 2018 For Small Business Owners"If you are already familiar with how the Qualified Business Income deduction works, please continue reading.
The Taxable Income Thresholds
Regardless of whether you are considered a “services business” or “non-services business” under the new tax law, you will need to be aware of the following income thresholds:
Individual: $157,500
Married: $315,000
These threshold amounts are based on the “total taxable income” listed on the tax return of the business owner. Not “AGI” and not just the pass-through income from the business. Total taxable income. For example, if I make $100,000 in net profit from my business and my wife makes $400,000 in W-2 income, our total taxable income on our married filing joint tax return is going to be way over the $315,000 threshold. So do we completely lose the 20% deduction on the $100,000 in pass-through income from the business? Maybe not!!
The Safe Zone
For many business owners, to maximize the new 20% deduction, they will do everything that they can to keep their total taxable income below the thresholds. This is what I call the “safe zone”. If you keep your total taxable income below these thresholds, you will be allowed to take your total qualified business income, multiply it by 20%, and you’re done. Once you get above these thresholds, the 20% deduction will either begin to phase out or it will trigger the alternative 50% of W-2 income calculation which may reduce the deduction. The phase out ranges are listed below:
Inidividuals: $157,500 to $207,500
Married: $315,000 to $415,000
As you get closer to the top of the range the deduction begins to completely phase out for “services businesses” and for “non-services business” the “lesser of 20% of QBI or 50% of wages paid to employees” is fully phased in.
What Reduces "Total Taxable Income"?
There are four main tools that business owners can use to reduce their total taxable income:
Standard Deduction or Itemized Deductions
Self-Employment Tax
Retirement Plan Contributions
Timing Expenses
Standard & Itemized Deductions
Since tax reform eliminated many of the popular tax deductions that business owners have traditionally used to reduce their taxable income, for the first time in 2018, a larger percentage of business owners will elect taking the standard deduction instead of itemizing. You do not need to itemize to capture the 20% deduction for your qualified business income. This will allow business owners to take the higher standard deduction and still capture the 20% deduction on their pass-through income. Whether you take the standard deduction or continue to itemize, those deductions will reduce your taxable income for purposes of the QBI income thresholds.
Example: You are a business owner, you are married, and your only source of income is $335,000 from your single member LLC. At first look, it would seem that your total income is above the $315,000 threshold and you are subject to the phase out calculation. However, if you elect the standard deduction for a married couple filing joint, that will reduce your $335,000 in gross income by the $24,000 standard deduction which brings your total taxable income down to $311,000. Landing you below the threshold and making you eligible for the full 20% deduction on your qualified business income.
The point of this exercise is for business owners to understand that if your gross income is close to the beginning of the phase out threshold, somewhere within the phase out range, or even above the phase out range, there may be some relief in the form of the standard deduction or your itemized deductions.
Self-Employment Tax
Depending on how your business is incorporated, you may be able to deduct half of the self-employment tax that you pay on your pass-through income. Sole proprietors, LLCs, and partnership would be eligible for this deduction. Owners of S-corps receive W2 wages to satisfy the reasonable compensation requirement and receive pass-through income that is not subject to self-employment tax. So this deduction is not available for S-corps.
The self-employment tax deduction is an “above the line” deduction which means that you do not need to itemize to capture the deduction. The deduction is listed on the first page of your 1040 and it reduces your AGI.
Example: You are a partner at a law firm, not married, the entity is taxed as a partnership, and your gross income is $200,000. Like the previous example, it looks like your income is way over the $157,500 threshold for a single tax filer. But you have yet to factor in your tax deductions. For simplicity, let’s assume you take the standard deduction:
Total Pass-Through Income: $200,000
Less Standard Deduction: ($12,000)
Less 50% Self-Employ Tax: ($15,000) $200,000 x 7.5% = $15,000
Total Taxable Income: $173,000
While you total taxable income did not get you below the $157,500 threshold, you are now only mid-way through the phase out range so you will capture a portion of the 20% deduction on your pass-through income.
Retirement Plans – "The Golden Goose"
Retirement plans will be the undisputed Golden Goose for purposes of reducing your taxable income for purposes of the qualified business income deduction. Take the example that we just went through with the attorney in the previous section. Now, let’s assume that same attorney maxes out their pre-tax employee deferrals in the company’s 401(k) plan. The limit in 2018 for employees under the age of 50 is $18,500.
Total Pass-Through Income: $200,000
Less Standard Deduction: ($12,000)
Less 50% Self-Employ Tax: ($15,000)
Pre-Tax 401(k) Contribution: ($18,500)
Total Taxable Income: $154,500
Jackpot!! That attorney has now reduced their taxable income below the $157,500 QBI threshold and they will be eligible to take the full 20% deduction against their pass-through income.
Retirement plan contributions are going to be looked at in a new light starting in 2018. Not only are you reducing your tax liability by shelter your income from taxation but now, under the new rules, you are simultaneously increasing your QBI deduction amount.
When tax reform was in the making there were rumors that Congress may drastically reduce the contribution limits to retirement plans. Thankfully this did not happen. Long live the goose!!
Start Planning Now
Knowing that this Golden Goose exists, business owners will need to ask themselves the following questions:
How much should I plan on contributing to my retirement accounts this year?
Is the company sponsoring the right type of retirement plan?
Should we be making changes to the plan design of our 401(k) plan?
How much will the employer contribution amount to the employees increase if we try to max out the pre-tax contributions for the owners?
Business owners are going to need to engage investment firms and TPA firms that specialize in employer sponsored retirement plan. Up until now, sponsoring a Simple IRA, SEP IRA, or 401(K), as a way to defer some income from taxation has worked but tax reform will require a deeper dive into your retirement plan. The golden question:
“Is the type of retirement plan that I’m currently sponsoring through my company the right plan that will allow me to maximize my tax deductions under the new tax laws taking into account contribution limits, admin fees, and employer contributions to the employees.”
If you are not familiar with all of the different retirement plans that are available for small businesses, please read our article “Comparing Different Types Of Employer Sponsored Plans”.
DB / DC Combo Plans Take Center Stage
While DB/DC Combo plans have been around for a number of years, you will start to hear more about them beginning in 2018. A DB/DC Combo plan is a combination of a Defined Benefit Plan (Pension Plan) and a Defined Contribution Plan (401k Plan). While pension plans are usually only associated with state and government employers or large companies, small companies are eligible to sponsor pension plans as well. Why is this important? These plans will allow small business owners that have total taxable income well over the QBI thresholds to still qualify for the 20% deduction.
While defined contribution plans limit an owner’s aggregate pre-tax contribution to $55,000 per year in 2018 ($61,000 for owners age 50+), DB/DC Combo plans allow business owners to make annual pre-tax contributions ranging from $60,000 – $300,000 per year. Yes, per year!!
Example: A married business owner makes $600,000 per year and has less than 5 full time employees. Depending on their age, that business owner may be able to implement a DB/DC Combo plan prior to December 31, 2018, make a pre-tax contribution to the plan of $300,000, and reduce their total taxable income below the $315,000 QBI threshold.
Key items to make these plans work:
You need to have the cash to make the larger contributions each year
These DB/DC plan needs to stay in existence for at least 3 years
This plan design usually works for smaller employers (less than 10 employees)
Shelter Your Spouse's W-2 Income
It's not uncommon for a business owner to have a spouse that earns W-2 wages from employment outside of the family business. Remember, the QBI thresholds are based on total taxable income on the joint tax return. If you think you are going to be close to the phase out threshold, you may want to encourage your spouse to start putting as much as they possibly can pre-tax into their employer's retirement plan. Unlike self-employment income, W-2 income is what it is. Whatever the number is on the W-2 form at the end of the year is what you have to report as income. By contrast, business owners can increase expenses in a given year, delay bonuses into the next tax year, and deploy other income/expense maneuvers to play with the amount of taxable income that they are showing for a given tax year.
Timing Expenses
One of the last tools that small business owners can use to reduce their taxable income is escalating expense. Now, it would be foolish for businesses to just start spending money for the sole purpose of reducing income. However, if you are a dental practice and you were planning on purchasing some new equipment in 2018 and purchasing a software system in 2019, depending on where your total taxable income falls, you may have a tax incentive to purchase both the equipment and the software system all in 2018. As you get toward the end of the tax year, it might be worth making that extra call to your accountant, before spending money on those big ticket items. The timing of those purchases could have big impact on your QBI deduction amount.
Disclosure: The information in this article is for educational purposes. For tax advice, please consult your tax advisor.
About Michael.........
Hi, I’m Michael Ruger. I’m the managing partner of Greenbush Financial Group and the creator of the nationally recognized Money Smart Board blog . I created the blog because there are a lot of events in life that require important financial decisions. The goal is to help our readers avoid big financial missteps, discover financial solutions that they were not aware of, and to optimize their financial future.


How Much Will The Value Of Your House Drop Under The New Tax Law?
It's not a secret to anyone at this point that the new tax bill is going to inflict some pain on the U.S. housing market in 2018. The questions that most homeowners and real estate investors are asking is: "How much are home prices likely to decrease within the next year due to the tax changes?" The new $10,000 limitation on SALT deductions, the lower

It's not a secret to anyone at this point that the new tax bill is going to inflict some pain on the U.S. housing market in 2018. The questions that most homeowners and real estate investors are asking is: "How much are home prices likely to decrease within the next year due to the tax changes?" The new $10,000 limitation on SALT deductions, the lower deduction cap mortgages interest, and the higher standard deduction are all lining up to take a bite out of real estate prices. The size of the bite will largely depend on where you live and the value of your house.
3 Bites That Will Hurt
The Trump tax reform made three significant changes to the tax laws that will impact housing prices:
Capped state and local tax ("SALT") deductions at $10,000 (includes property taxes)
Lowered the deduction cap on the first $750,000 of a mortgage
Doubled the standard deduction
The New Standard Deduction
There is a reason why I'm starting this analysis with the doubling of the standard deduction in 2018. For many households in the U.S., the doubling of the standard deduction will make the cap on the SALT deductions irrelevant. Let me explain. Below is a comparison of the standard deduction limits in 2017 versus 2018:

new standard deduction
In 2018, a married couple filing a joint tax return would need over $24,000 in itemized deductions to justify not taking the standard deduction and calling it a day. For a married couple, both W-2 employees, $7,000 in property taxes, $9,000 in state income taxes, if those are their only itemized deductions, then it will most likely makes sense for them to take the $24,000 standard deduction. So the $10,000 cap on property taxes and state income taxes becomes irrelevant because it’s an itemized deduction. This will be a big change for many U.S. households. In 2017, that same family may have itemized because their property and state taxes exceeded the $12,700 standard deduction threshold.
For taxpayers age 65 and older, the new tax law kept the additional standard deduction amounts: $1,250 for single filers and $2,500 for married filing joint which are over and above the normal limits.
$10,000 Cap On State & Local Taxes
Starting in 2018, taxpayers are limited to a $10,000 deduction for a combination of their property taxes, school taxes, and state & local income tax. For states that have both high property taxes and high income taxes like New York, New Jersey, and California, homeowners will most likely be looking at a larger decrease in the value of their homes versus states like Florida that have lower property taxes and no state income taxes. The houses with the higher dollar value may experience a larger drop in price.
If you live in a $200,000 house, the property / school taxes are $5,000, and you decided to sell your house, the family looking to buy your house may already be planning on taking the $24,000 standard deduction at that income level, so the new tax cap would not really decrease the “value” of the house to the potential buyer.
On the flip side, if you own a $600,000 house, your property/school taxes are $18,000, and you are looking to sell your house, the new $10,000 cap will most likely have a negative impact on the value of your house. As you might assume, the individuals and families with the higher incomes that could afford to purchase a $600,000 house will naturally be the homeowners that will continue to itemize their deduction in 2018. So owning that $600K house in 2018 comes at an additional annual cost to the buyer because they lose $8,000 in property tax deductions. For individuals and families in the top federal tax bracket (37%), the cost to live in that house just went up by $3,120 per year. I have personally already had two clients call me that just purchased a house in 2017 with property taxes above the $10,000 cap and they said “I might not have purchased this big of a house if I knew I was not going to be able to deduct all of the property taxes”.
$750,000 Deduction Cap On Mortgages
Prior to 2018, taxpayers could only deduct interest on the first $1,000,000 of a mortgage. For all new mortgages, beginning in 2018, the cap was reduced from $1,000,000 to $750,000. The new tax law grandfathered the $1M cap for mortgages that were already in existence prior to December 31, 2017. Obviously this change will only impact very high income earning individuals and families living in houses valued at $1M+ but it still may have a negative impact on the prices of those big houses. I say "may" because if you can afford a $3M condo in Manhattan, you may not care that you lost a $7,500 tax deduction.
It Depends Where You Live
Given these changes to tax law, it seems likely that the states with higher property taxes and higher home values will be the most vulnerable to price adjustments. Below is a map, from Zillow and Credit Suisse, showing the median home price by state:
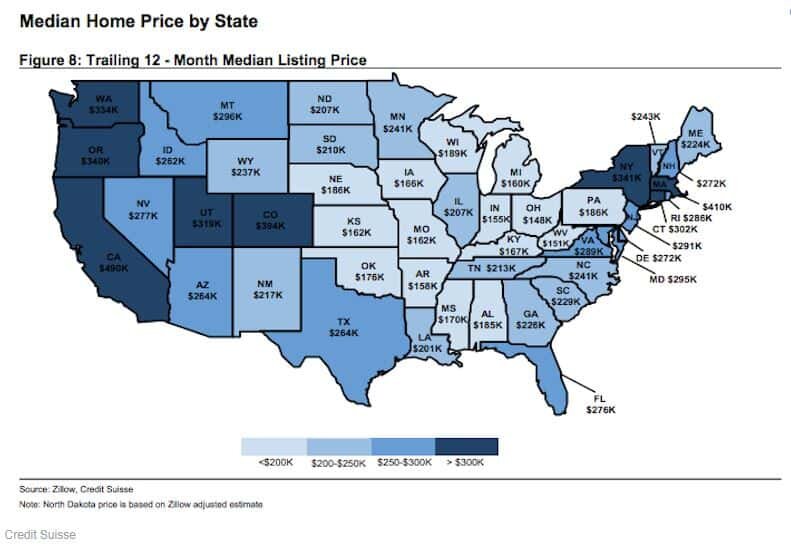
median home price
Let's also locate the states that have a high concentration of mortgages over $500,000. As mentioned above, this may put price pressure on homeowners trying to sell houses above the new $750,000 mortgage interest deduction threshold:
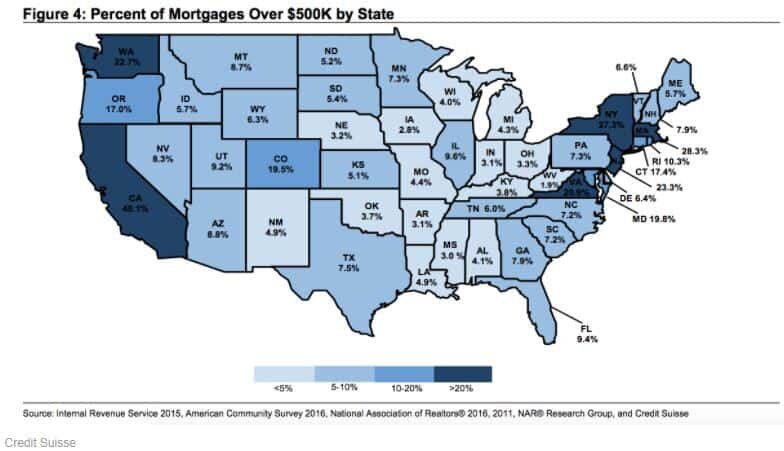
states with high mortgages
And the "Non-Winners" are New York, California, and New Jersey. Moody's published a list of the 25 counties that are expect to lose the largest percentage of value. Note, that only six of those counties are located outside of New York or New Jersey:

tax reform impact on housing prices
To bring it all together, Moody's and FHFA published the illustration below showing the percentage change in the Federal Housing Finance Agency – House Price Index as a result of the new tax bill:
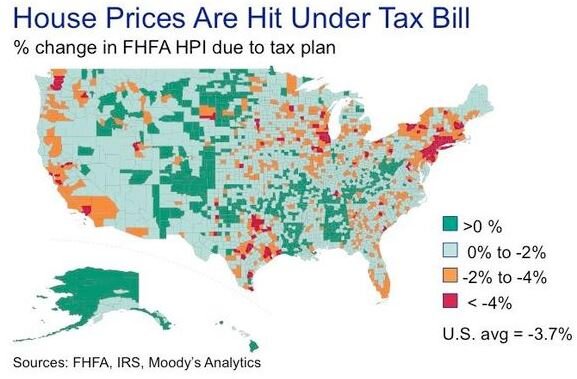
house price decline
It's safe to assume that geographically, the negative impact that the new tax rules will have on the U.S. house market will occur in concentrated pockets as opposed to a widespread reduction in housing prices across the country.
Do Not Move To Alaska Just Yet!!
Before you show the chart above to your family at dinner tonight with a “Go Alaska” hat on, I urge you to read on. (Disclosure, I have nothing against Alaska. I was born in Fairbanks, Alaska) If you live in one of the “red spots” on the heat map above or in one of the counties in the list of “where home prices could stall after tax reform”, the charts above do not necessarily mean that at the end of 2018 your house is going to be worth 5% less than it was at the beginning of 2018. Moody’s has done the comparison of the tax bill passing versus no tax bill. If prior to the tax bill being passed it was estimated in 2018 that homes in your area were going to increase in value by 5% and the heat map above shows a 4% drop as a result of tax reform, then that means instead the value of your home growing by 5% it may only grow by 1%.
As with any forecast, it’s anyone’s guess at this point how the math will actually work itself out but in general I think it will be more positive than the consensus expects.
House Values Under $250,000 – Status Quo
Given the changes to the tax law, if you live in a house that is valued under $250,000, regardless of where you live, the downward pressure on the price of your house as a result of tax reform should be minimal. Why? Most buyers in this range will most likely be electing the standard deduction anyways so the new $10,000 cap on SALT deductions should have little to no impact. This should even be true for states that have high property taxes because the homeowners would need over $24,000 in itemized deductions before the $10,000 cap would potentially hurt them tax wise.
The Sandwich: House Values $250,000 - $750,000
The homeowners at the highest risk of a reduction in the value of their house are located in what I call “The Sandwich”. They have a house that is valued somewhere between $250,000 – $750,000 and they live in a high property tax state. While Congress touts that the doubling of the standard deduction is a “fix all” for all of the tax deductions that have been taken away, it’s unfortunately not. There are a number of individuals and families that are in the income range customarily associated with buying a $250K – $750K house that may actually pay more in taxes under the new rules.
Taxpayers in this group are also moving from their “starter house” in their first “big house”. Unlike the super wealthy that may care less about paying an extra $5,000 in taxes per year, for an upper middle class family that has kids, that is saving for college, and contributing to 401(k) plans, the loss of that tax benefit may mean they can’t take a family vacation if they buy that bigger house. Less buyers in the market for houses in this “Sandwich” range translates to lower prices.
How much lower? Probably nothing dramatic in the short term because the U.S. economy is doing so well. When the economy is growing, people feel secure in their jobs, wages are going up, workers are getting bonuses, and that provides them with the additional income needed to make that larger mortgage payment and pay a little more in taxes.
My concern would be for someone that is planning to purchase a house and then sell within the next 5 years. If the economy goes into a recession, people start losing their jobs, and the U.S. consumer starts look for more ways to stretch their dollars, the homeowners that stretched themselves to buy the bigger house based on the big bonus that they received when the economy was humming are at a big risk of losing their house. In addition, there may be fewer buyers in the market because families may not want to waste money on property taxes that they can’t deduct.
The Millionaire Club: House Values $750,000+
It would seem that houses in the $750,000+ range have the most lose to for two reasons. First, homeowners in this category pay the highest property taxes and they are typically not electing the standard deduction at this income level. Second, home buyers at this price point would also be negatively impacted by the lower $750,000 cap on the mortgage interest deduction.
But I doubt this will be the case. Why? There is only so much lake front property. If you make over $5M per year and you fall in love with a lake house in upstate New York that has a $1.5M price tag, while you could try to find a similar lake house in a more tax friendly state, if you make $5M per year, what’s another $15,000 in expenses for buy your first choice.
About Michael.........
Hi, I’m Michael Ruger. I’m the managing partner of Greenbush Financial Group and the creator of the nationally recognized Money Smart Board blog . I created the blog because there are a lot of events in life that require important financial decisions. The goal is to help our readers avoid big financial missteps, discover financial solutions that they were not aware of, and to optimize their financial future.

