

Trump Has The Stock Market and Fed Cornered
The stock market selloff continues amid the escalation of the trade wars between the US and 180 other countries. It’s left investors asking the questions:
Where is the bottom?
Are we headed for a recession?
Unfortunately, the answers are largely rooted in the decisions that President Trump makes in the coming days and weeks. There have been talks about the Fed decreasing rate, tax reform getting passed sooner, negotiations beginning with 50 of the 180 countries that we placed tariff on, but in this article we are going to explain why all of these solutions may be too little too late when it comes to the overall negative impact that tariff are currently having on the US economy.

The stock market selloff continues amid the escalation of the trade wars between the U.S. and 180 other countries, and it’s left investors asking the questions:
Where is the bottom?
Are we headed for a recession?
Unfortunately, the answers are largely rooted in the decisions that President Trump makes in the coming days and weeks. There have been talks about the Fed decreasing rates, tax reform getting passed sooner, and negotiations beginning with 50 of the 180 countries that we placed tariffs on. In this article, we are going to explain why all of these solutions may be too little too late when it comes to the overall negative impact that tariffs are currently having on the U.S economy.
Trump Holds All of the Cards
In our opinion, the only way out of this market selloff is a policy pivot by the Trump administration on the latest round of tariffs - which could be announced ant any moment. Markets would likely respond very positively to any sign of relief. This could come in the form of a “pause” in the assessments of the tariffs for a specific number of days to provide time for negotiations to take place, or the Trump administration could reverse course, either walking back or reducing the tariff amounts that are currently being assessed.
Notice that I didn’t add to the list that “tariffs are either eliminated or reduced by successfully negotiating with 180 countries on which tariffs have been placed.” While this would typically be an option, we do not believe that the Trump administration has the manpower to successfully negotiate with 180 countries simultaneously in a way that would reduce or eliminate the tariffs before they negatively impact the global economy.
The magnitude of the tariff is a real problem, and we believe this to be one of the big missteps by the Trump administration in trade negotiations. The reciprocal tariffs are not based on the tariffs that are being levied against U.S. goods being imported by other countries, but rather a formula by the Trump administration that’s based on the trade deficit between the U.S. and these various countries, which is not prudently resolved through the assessment of tariffs.
For example, let's say that Japan assesses a 5% tariff against U.S. imports. Since the U.S. imports more from Japan than Japan imports from the U.S., this results in a trade deficit between the two countries. The Trump administration has decided not to levy a reciprocal tariff based on the 5% actual tariff levied against U.S. goods but rather is assessing a much larger tariff based on the amount of the trading deficit between the U.S. and Japan. However, this might not be the root cause of the trade imbalance. Another example: let's say the U.S. consumer prefers buying Japanese electronics, but there aren’t naturally many things that Japan buys or needs from the U.S. This would cause exports from Japan to exceed imports from the U.S., which is being driven largely by consumer demand, not tariffs. However, the Trump administration is now assessing sizable tariffs against Japan to try to reduce the trade deficit. In effect, this approach either forces Japan to buy more goods from the U.S. or for the U.S. consumer to buy less goods imported from Japan - even those products are preferred for their quality over alternatives from other countries.
In a way, the Trump administration is trying to use a hammer to fix a problem that requires a screwdriver. In addition, it was recently pointed out on an analyst call that since the United States spends more than it makes, we are naturally going to run deficits with other countries because we're purchasing more than we produce as a country. If we are concerned with the U.S. trade deficits, and although tariffs may be a contributing factor, the lion’s share of the problem may be the U.S. just outspending what we produce each year.
Tariffs are Paralyzing the Global Economy
While we have seen the tariffs being implemented this week, just the threat of tariffs has a paralyzing impact on both the U.S. and global economy. Since there is so much at stake in the negotiation of these tariffs, it causes companies to put off purchasing decisions, hiring decisions, new construction, and encourages companies to sit on their cash, not knowing which direction the economy will go from here.
Not only do we need a pause, delay, or elimination of the tariff to stave off a recession, but it needs to happen within a reasonable period of time, because the reduction in spending by consumers and businesses during this wait-and-see approach is already reducing the GDP in Q2, which could push the QDP negative in Q2 and potentially Q3. Two consecutive quarters of negative GDP is a recession.
Delay In Building New Factories
While the Trump administration's main goal with the trade negotiations is to bring more manufacturing back to the United States, these are multibillion-dollar decisions for these publicly traded companies. For example, it’s estimated that if Apple were to move forward with building a new multi-billion facility in the U.S., it might take them 10 years to build it. The catalyst for building it in the first place would be to avoid having to pay the tariffs on iPhones that are being imported from China. But if you're Apple, do you commit to spending billions to build a new factory in the US when in 4 years there could be a change in the administration in Washington and then the tariffs could be removed, making it no longer prudent to produce hardware in the United States? These are the decisions that these big multinational companies face before pulling the trigger on bringing manufacturing back to the United States.
Labor Shortage
Another reasonable question to ask is if all these manufacturing jobs come back to the United States, do we have enough workers to hire in the U.S. to run those factories? The unemployment rate in the U.S. is 4.2%, which is well below the 6% historical trend. With the Trump administration greatly limiting immigration into the U.S., it’s difficult to pinpoint where all these additional workers would come from within the U.S.
The Fed is Stuck
The Fed is stuck between a rock and a hard place. Normally, when there is weakness in the U.S. economy, the Fed will step in and begin lowering interest rates. However, tariffs are inflationary, so if the Fed begins reducing rates to help the economy while prices are moving higher because of the tariffs, it could result in another round of hyperinflation like we saw coming out of COVID. This may cause the Fed to stay on pause, meaning the markets may not receive any immediate help from the Fed in the near future.
Tax Reform
There is also the argument to be made that weakening the U.S. economy may allow larger tax cuts to be passed with the anticipation of the Trump tax cuts that are currently working their way through Congress. While this may very well be true, again, it’s a timing issue. Tax reform is a slow-moving animal, and even in the best-case scenario, we may not see the tax reform passed until August 2025 or later, but by then the U.S. economy could already be in a recession if the tariff issues are not resolved.
Waiting For the Recovery
The economy is truly balancing on the edge of a knife right now. An announcement at any moment from the Trump administration indicating a pause or reduction of the tariff could make the last few weeks just a bad dream. But it’s not just that relief happens, but that the U.S. economy likely needs to receive that relief soon to avoid too much damage from happening due to the economic paralysis in the interim. There are very few moments in history where so much is riding on policy coming out of Washington that it becomes difficult to predict which path the U.S. economy will follow in coming weeks and months. This is truly a situation where investors will have to assess the data each day and what the developing trends in the economic data are to determine whether or not changes should be made to their asset allocation.

About Michael……...
Hi, I’m Michael Ruger. I’m the managing partner of Greenbush Financial Group and the creator of the nationally recognized Money Smart Board blog . I created the blog because there are a lot of events in life that require important financial decisions. The goal is to help our readers avoid big financial missteps, discover financial solutions that they were not aware of, and to optimize their financial future.


The March Selloff – Trouble on the Surface
March was a tough month for the stock market, with the S&P 500 Index dropping by over 5% for the month. With the new “Liberation Day” tariffs going into effect on April 2nd, many investors are asking if the new tariffs and the recent stock market correction warrant a change in investment strategy. Will the selloff continue, or are we in store for a market rally in April?
In this article, we will share our market analysis, highlight key economic data points to watch as the new tariffs are rolled out, and answer the question: Do recent events warrant a change in investment strategy?

After conducting hundreds of client meetings over the past 90 days, I would best describe investors' overall sentiment as “emotionally charged.” There is a lot of fear, anxiety, and uncertainty, with no shortage of media headlines on a daily, and often hourly, basis. Historically, in the short term, the market is not a fan of this type of environment which may have been a significant contributor to the more than 5% selloff in the S&P 500 Index in March. However, if there is a lesson that I have learned over the past 20 years in the investment industry, it’s that emotions can easily lead to investors making irrational investment mistakes, with “fear” serving as the captain of that team.
That then begs the question, how do you know when fear is warranted versus when fear is a distraction? The answer: look at the data. Data is unemotional. Data often reveals what’s really happening in labor markets, the economy, consumer behavior, the historical impact of policies coming out of Washington, and more. Data also enables us to examine the historical trends of similar data in the past and use them to forecast potential outcomes in the future.
Today, I’ll be sharing with you the key data points that may help determine where the markets go from here.
Data Point #1: 8
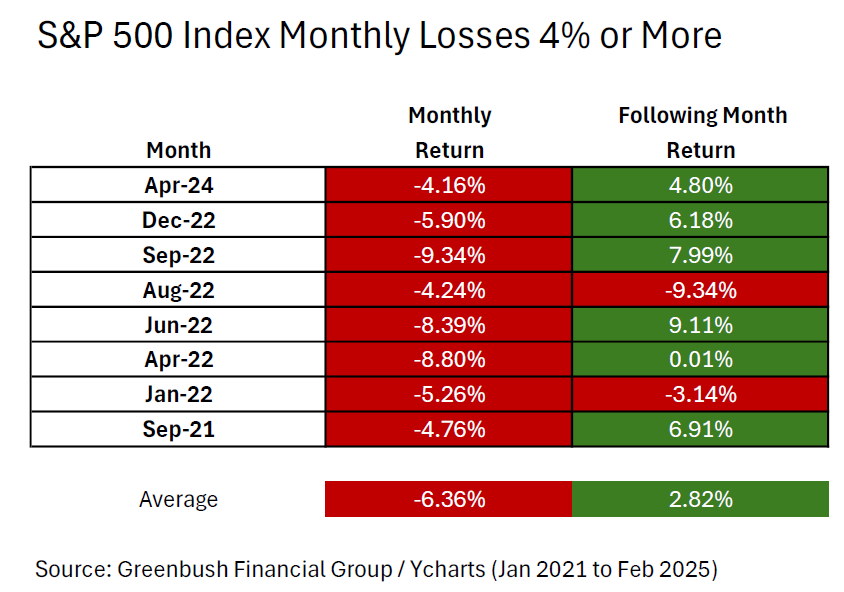
Prior to the recent 5%+ selloff in the S&P 500 Index in March, 8 is the number of times since January 2021 that the S&P 500 Index has dropped by more than 4% in a single month.
Data Point #2: -6.36%
For the 8 months that the S&P 500 Index dropped by over 4% in a single month between January 2021 and February 2025, -6.36% was the average monthly drop in the S&P 500 Index during that 8 month period. The S&P 500 was down 5.8% for the month of March.
Data Point #3: 6 of 8
Important next question: After the S&P 500 Index dropped by more than 4% in each of those months, did the losses historically continue, or did the market typically stage a recovery in the following month? In 6 of the 8 occurrences, the S&P 500 posted a positive return in the month following the 4%+ monthly drop.
Data Point #4: 2.82%
If we look at ALL eight 1-month periods following the month that the S&P 500 Index dropped by 4%+ in a single month, on average, the S&P 500 Index was up 2.82% in the following month.
Here is the chart with all the data for Data Points #1 through #4:
Trump 1.0 versus Trump 2.0
When President Trump announced the first round of tariffs in February 2025, we released an article comparing the market behavior we were seeing under Trump 2.0 versus the market trends and reactions to Trump’s policies during his first term (Trump 1.0).
Article: Trump Tariffs 2025 vs Trump Tariffs 2017
Again, more data. During Trump’s first term, he announced tariffs throughout the 4-year period, he signed waves of executive orders, there were multiple sizable sell-offs in the stock market, and market volatility remained high throughout his first four-year term. It was an “emotionally charged” environment similar to now. However, what we also pointed out in that article is that, ignoring the emotions, market volatility, and politics, the S&P 500 Index was up just over 16% annualized during the Trump 1.0 era.
Will history repeat itself? Since he just took office two months ago, we still need more time to collect the economic data to compare the trend. While we acknowledge that the tariffs being levied under Trump 2.0 are impacting more countries than those under Trump 1.0, the knee-jerk reaction from markets is similar today as to what we saw during Trump’s first term.
Tax Reform is Yet To Come
The news outlets right now are filled with headlines about new tariffs, federal employee layoffs, inflation risks, recession fears, and more. The one positive item that may be getting lost in the mix is that since the Republicans control Congress and the White House, there is a high probability that the Tax Cut and Jobs Act that were set to expire will get extended, and additional favorable tax provisions will most likely be passed either the second half of 2025 or in 2026.
Data Point #5: 5 of 7
Since 1945, Congress has passed 7 major tax reform bills. In 5 of the 7 years that major tax reform was passed, the S&P 500 Index posted a positive return for the year.
Data Point #6: 13.12%
If you total up the S&P 500 Index performance in each of the 7 years that tax reform was passed (both the positive and negative years), the S&P 500 Index averaged a 13.12% annual rate of return in the year that tax reform was passed by Congress. The explanation is easy: lower taxes means more money stays in the pockets of individuals and corporations, that money is then spent, and the U.S. is still largely a consumer-driven economy.

A special note here as well: if consumers and corporations have more money from lower taxes, that may help them weather some of the price increases resulting from the tariff activity.
Politics, Emotions, and Investing
March was a tough month for the markets. It’s never fun looking at a monthly statement following a 5.8% drop in the stock market. I shared with you today a few of the many data points that we are tracking across markets and the economy to assist our clients in making informed investment decisions that will enable them to meet their short-, medium-, and long-term financial objectives. In periods of heightened emotion, calm can often be found in looking beyond the politics and news headlines, and focusing on hard data and historical trends that can guide us in determining whether or not changes should be made to the asset allocation in client accounts.
Even after turning the page on a tough month for the market, we have yet to see a meaningful deterioration in the economic data within the economy. If the tariffs that are being implemented begin to have an significant impact on the economy, we would expect to see a meaningful rise in the unemployment rate as companies begin to lay off workers, a drop in manufacturing hours worked, a drop in new housing permits, and a steeper inversion of the yield curve, and we have yet to see a meaningful change in any of those data points.
It's also important to remember that one or two months of bad data is not a meaningful trend, and there is not a single indicator that, by itself, trips the alarm bells. Rather, it is a combination of multiple indicators over a multi-month period of time where meaningful trends develop and can be used in determining whether or not the current environment warrants a change in investment strategy.
About Michael……...
Hi, I’m Michael Ruger. I’m the managing partner of Greenbush Financial Group and the creator of the nationally recognized Money Smart Board blog . I created the blog because there are a lot of events in life that require important financial decisions. The goal is to help our readers avoid big financial missteps, discover financial solutions that they were not aware of, and to optimize their financial future.
